Debt reaches $31 Trillion
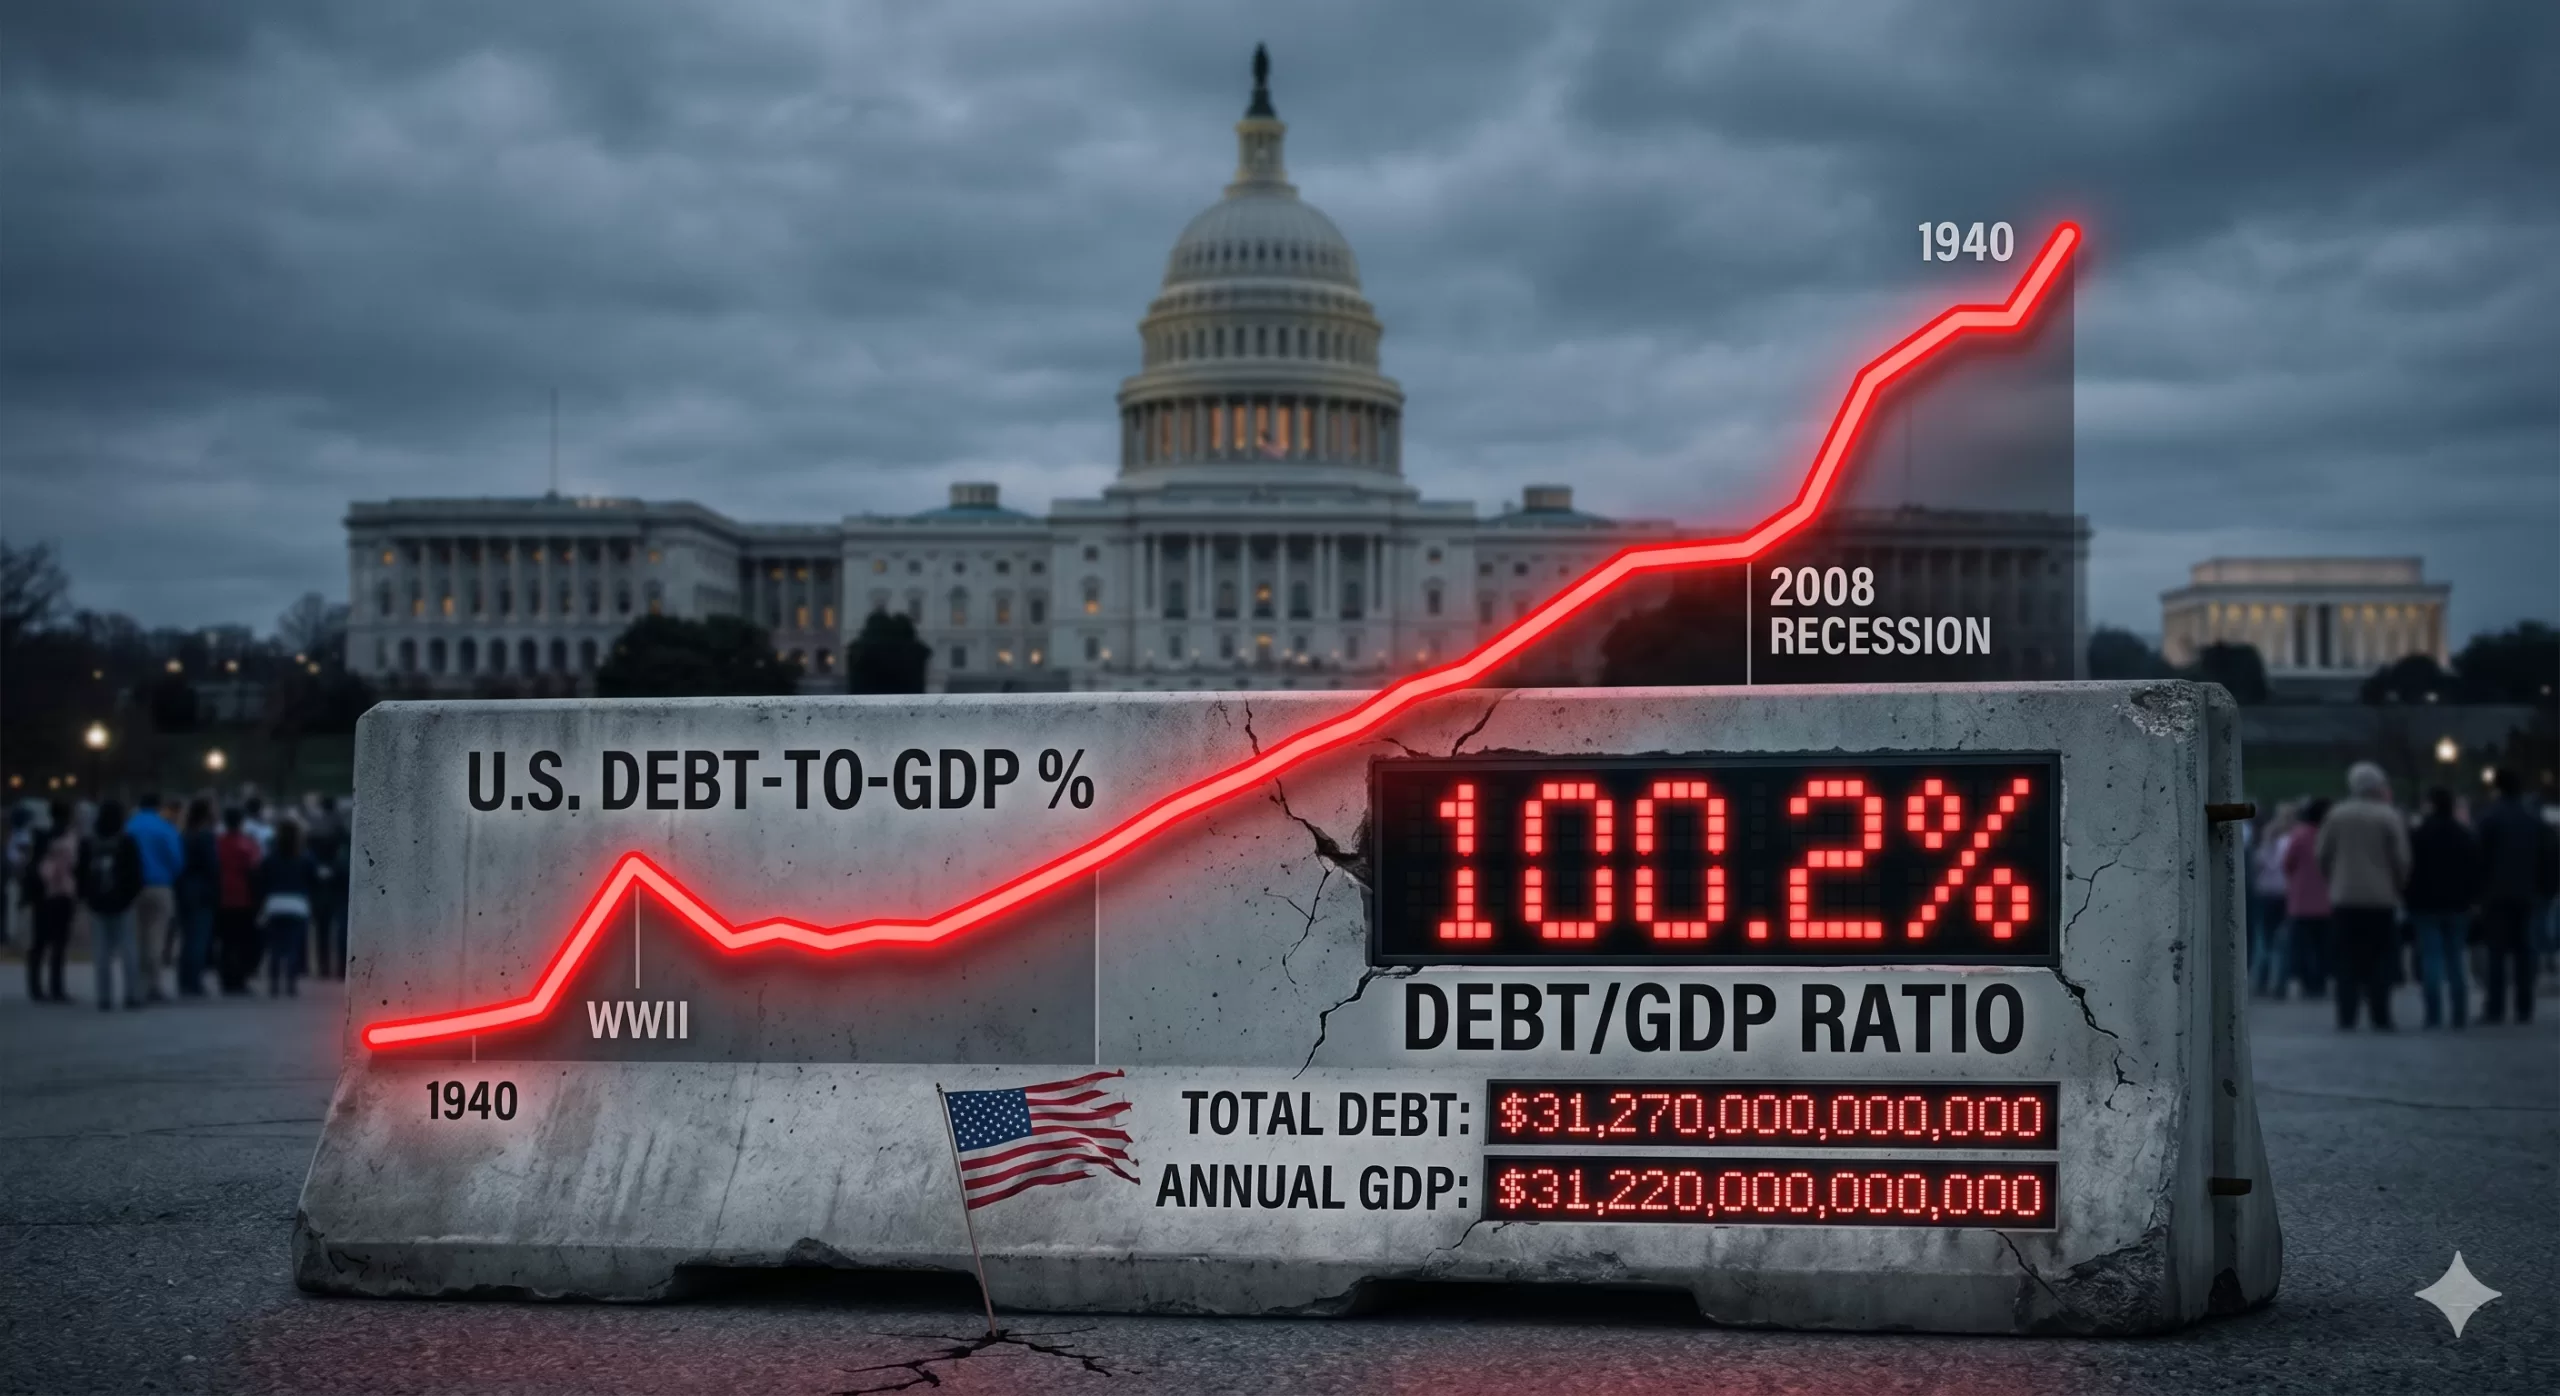
For the first time since the aftermath of World War II, the United States has reached a fiscal milestone that was once a distant “what-if” scenario: the national debt has officially surpassed 100% of the country’s Gross Domestic Product (GDP).
As of March 31, 2026, the debt held by the public reached $31.27 trillion, while the total annual economic output sat at $31.22 trillion. In simple terms, we now owe more as a nation than we produce in an entire year.
While “trillions” can feel like abstract Monopoly money, this 100.2% ratio represents a fundamental shift in the American economic landscape. Here is what you need to know about why this happened and what it means for the future.

How Did We Get Here?
This wasn’t an overnight accident. It is the result of decades of “fiscal kicking the can.” The surge to 100% was fueled by three primary engines:
- Structural Deficits: For years, the government has spent roughly $1.33 for every $1.00 it collects in revenue.
- The Interest Trap: As the total debt grows, so do the interest payments. In 2026, the U.S. is projected to spend approximately $1 trillion on interest alone—surpassing the entire national defense budget.
- Demographic Shifts: An aging population is naturally drawing more heavily on Social Security and Medicare, programs that make up a massive portion of mandatory spending.
Why the 100% Threshold Matters
Economists often debate whether there is a “magic number” where debt becomes fatal. While 100% isn’t an immediate “cliff,” it serves as a critical psychological and economic warning light for several reasons:
- Slower Economic Growth: Historical data suggests that when a nation’s debt exceeds 90% of GDP, average annual growth tends to slow. Resources that could be used for private investment or infrastructure are instead diverted to servicing old debt.
- Reduced “Crisis Cushion”: When the next pandemic, recession, or war hits, the government has less “dry powder” to respond. Borrowing your way out of a crisis is much harder when your credit card is already maxed out relative to your income.
- Generational Equity: The debt essentially represents a “tax” on future generations. Today’s spending is being financed by the earnings of Americans who haven’t even entered the workforce yet.
The Cost to the Average Household
To bring these massive numbers down to earth, the Senate Joint Economic Committee’s April 2026 update provides a sobering breakdown:
- Debt per Person: Approximately $114,000
- Debt per Household: Approximately $289,000
Is There a Way Out?
The U.S. has been here before. After 1945, the debt-to-GDP ratio was successfully whittled down to 34% by 1980. However, that was achieved through a unique combination of post-war industrial dominance, a massive “Baby Boom” workforce, and rapid GDP growth.
Today, the path is narrower. Solutions generally fall into three difficult categories:
- Entitlement Reform: Adjusting Social Security and Medicare to match modern life expectancies.
- Revenue Increases: Raising taxes or closing loopholes to narrow the deficit.
- Growth Incentives: Policies designed to make the “GDP” side of the ratio grow faster than the “Debt” side.
The Bottom Line
Crossing the 100% threshold is a “reckoning” moment. It signals that the era of “cheap” borrowing is over. As interest payments continue to eat a larger slice of the federal pie, the pressure on the American taxpayer—and the pressure to make hard political choices—will only intensify.
The red line has been crossed. The question now is whether we have the political will to head back toward the black.
Contact Factoring Specialist, Chris Lehnes