IEEPA Tariff Refunds
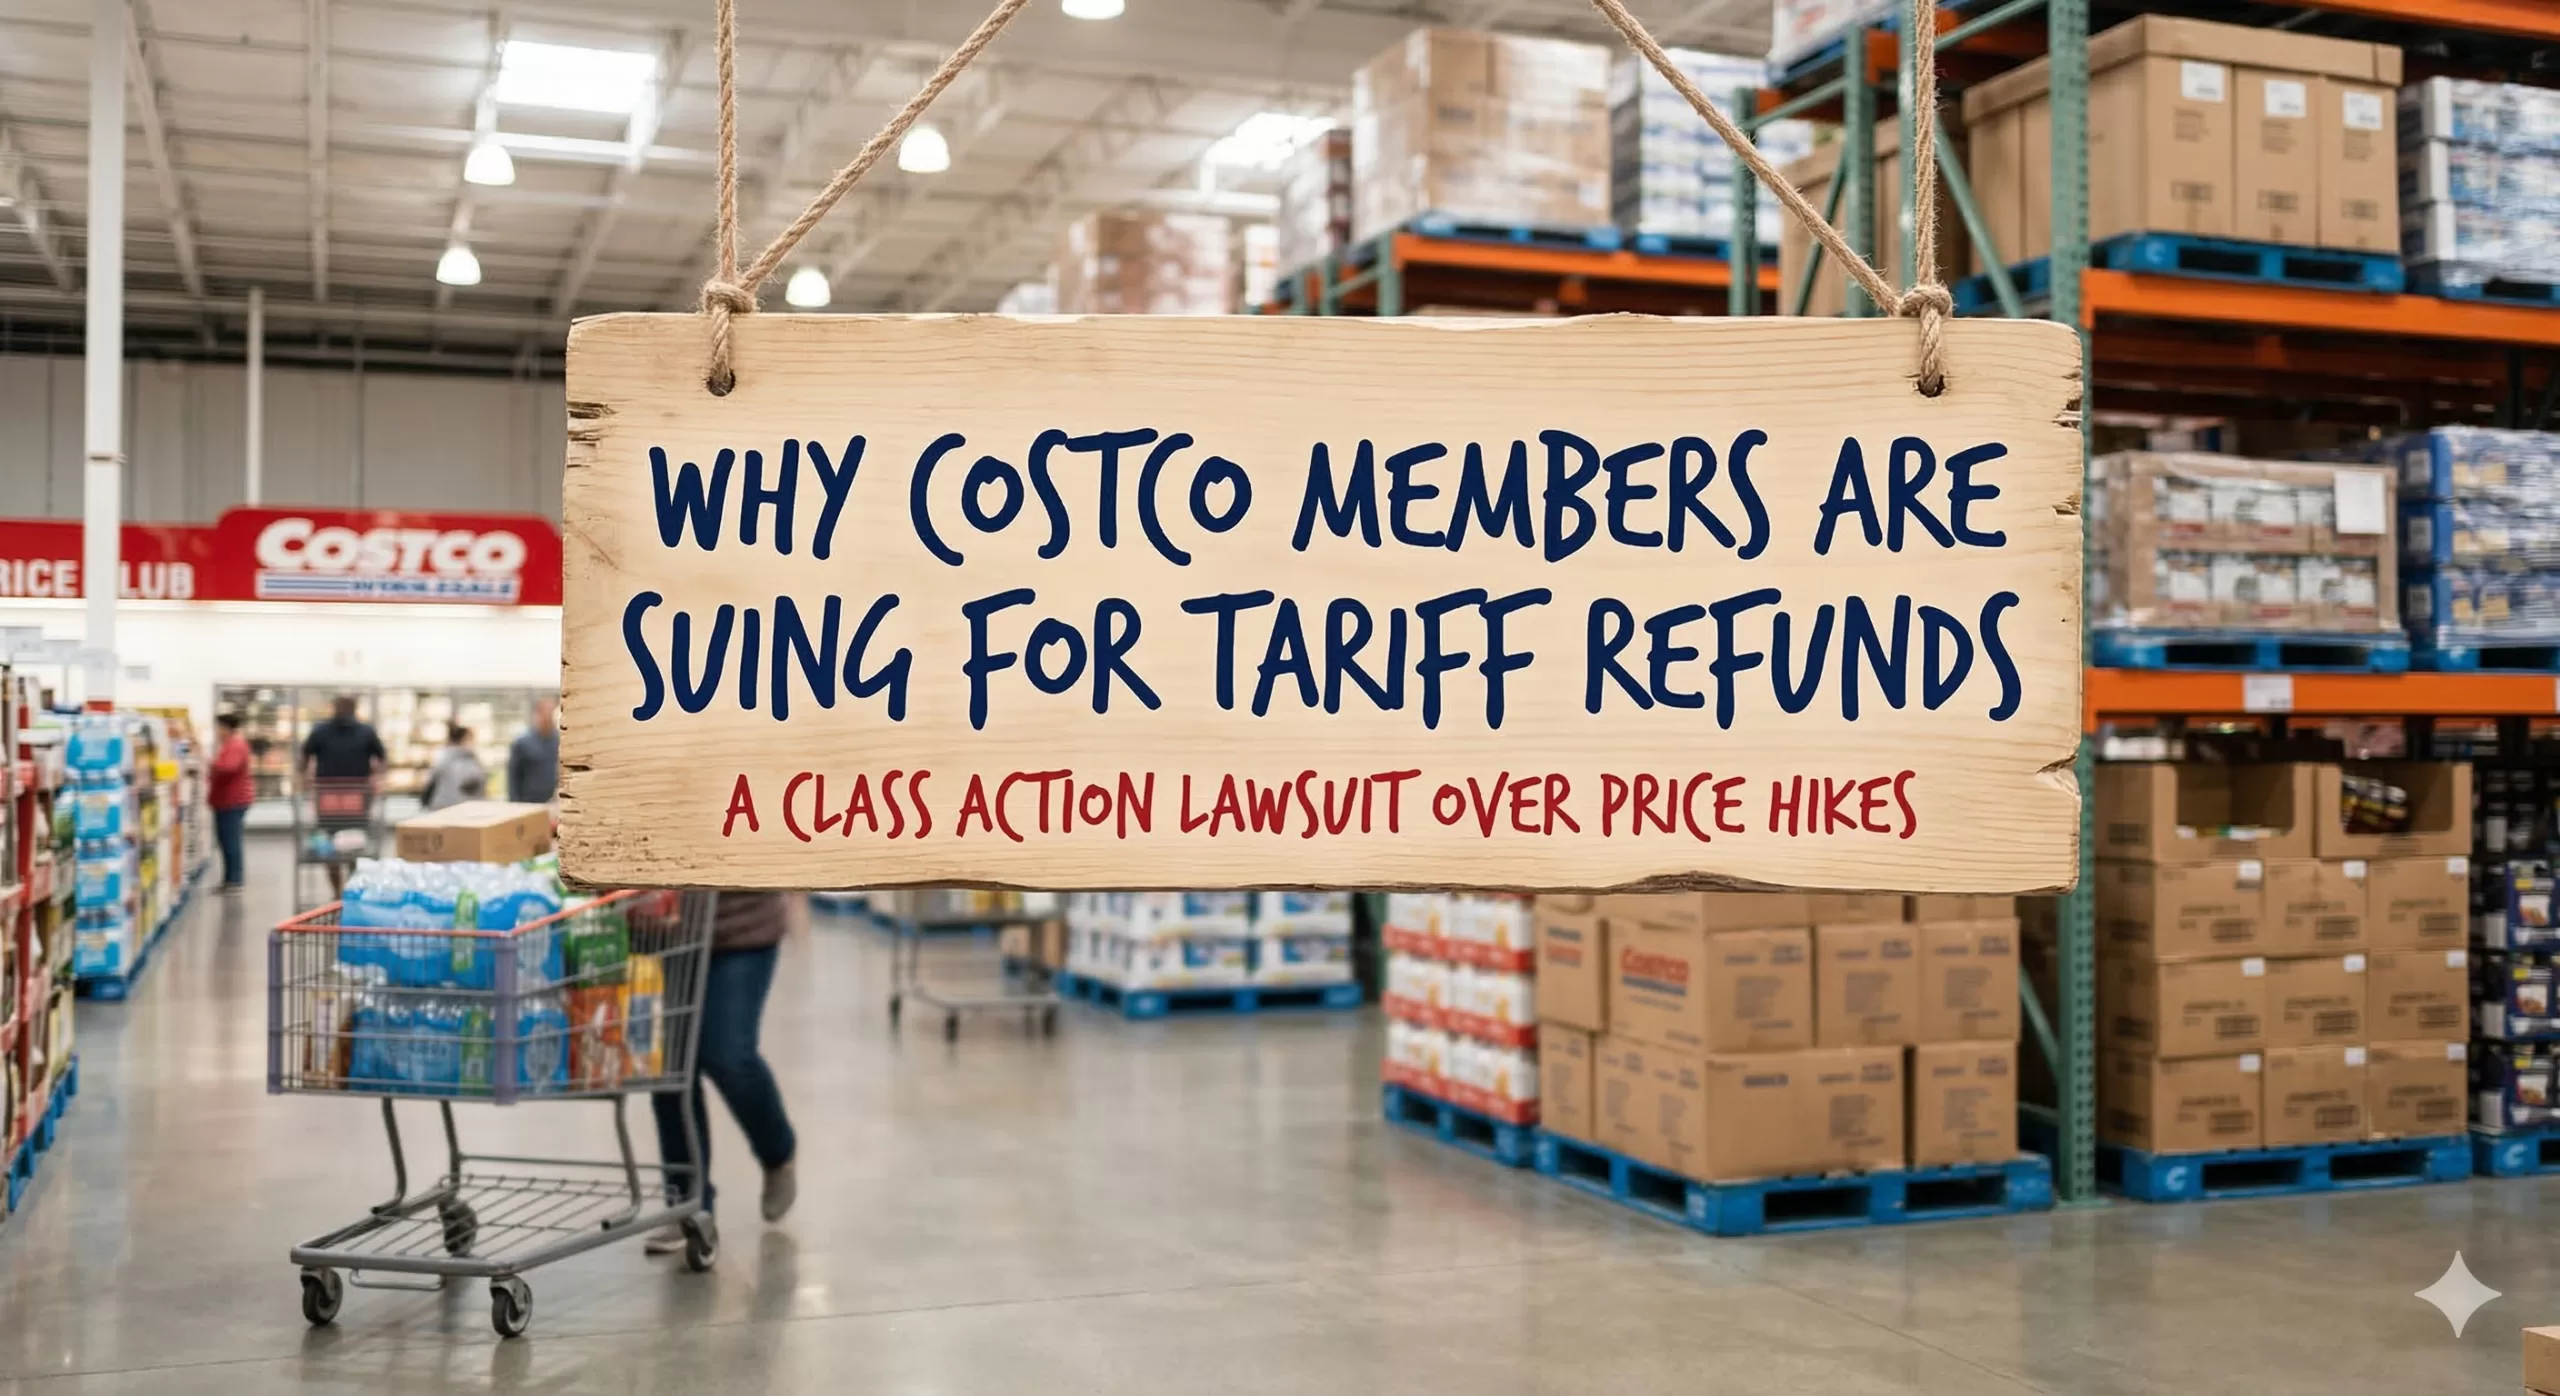
If you’ve noticed your Costco hauls getting a little pricier over the last year due to tariff passthrough, you aren’t alone. But a new legal battle is brewing that asks a multi-billion-dollar question: If a retailer gets a refund for the “illegal” tariff they passed on to you, who actually keeps the cash?
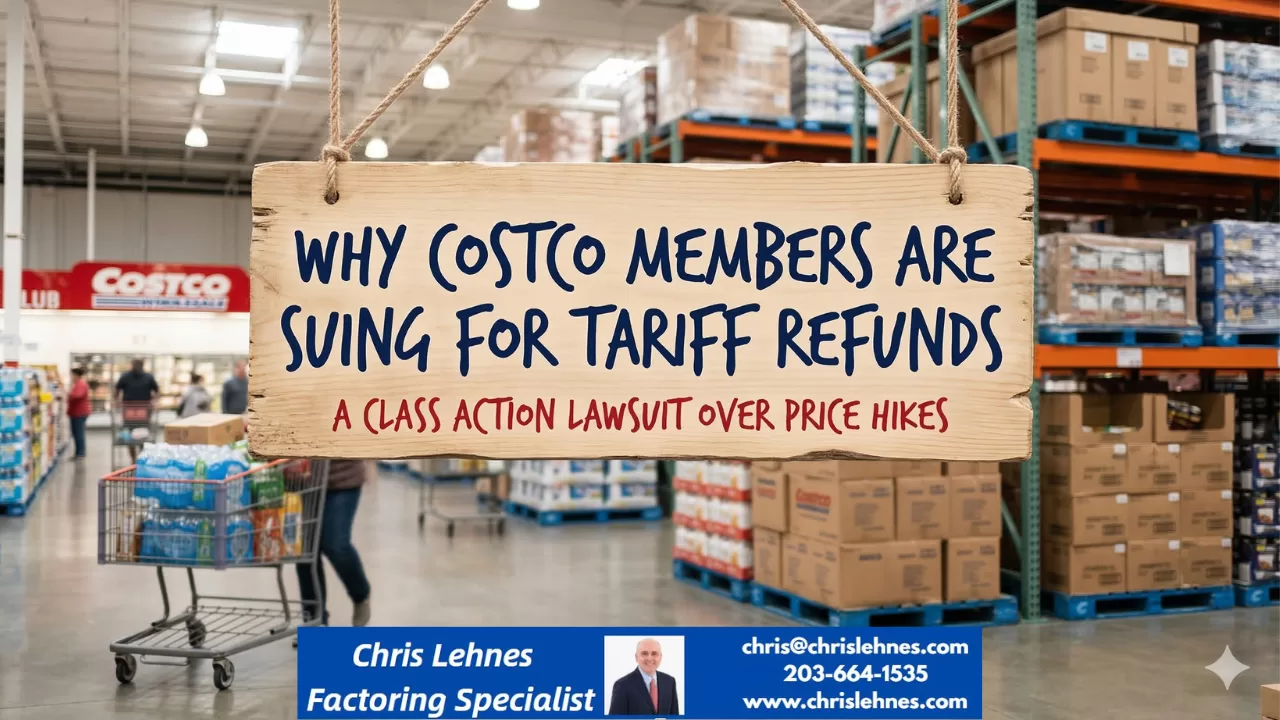
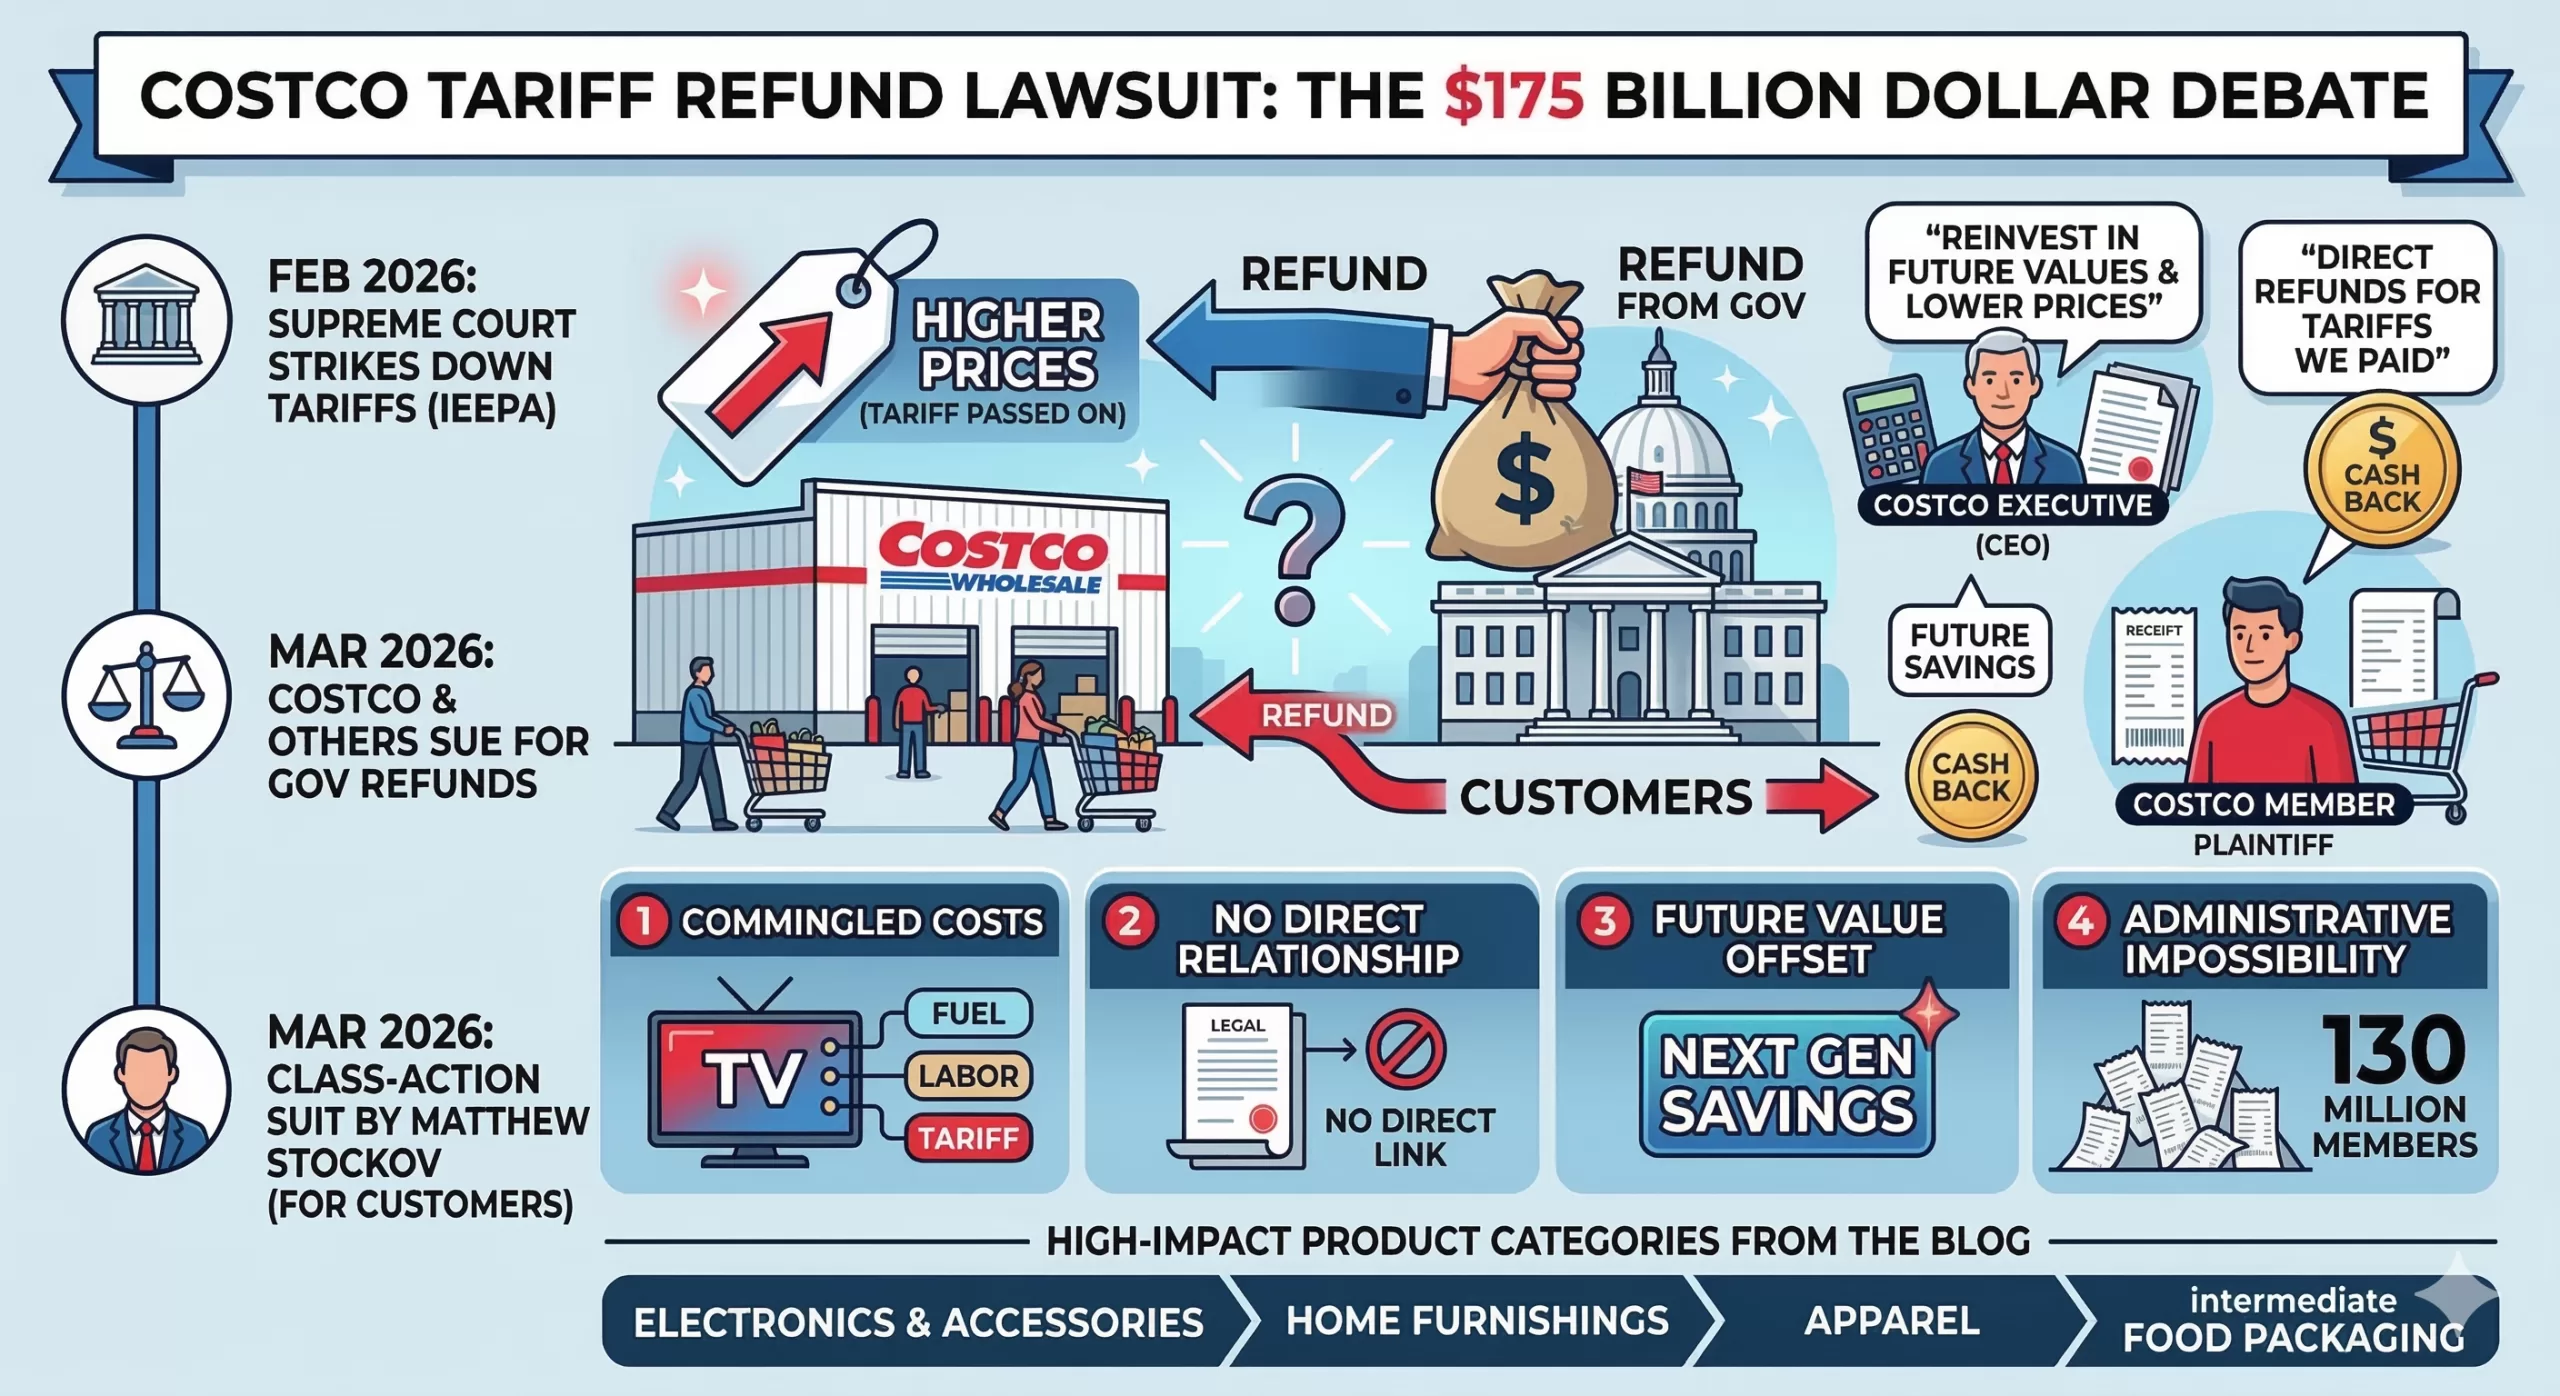
On Wednesday, March 11, 2026, a Costco member in Illinois filed a nationwide class-action lawsuit against the retail giant. The goal? To ensure that any tariff refunds Costco receives from the federal government end up back in the pockets of the shoppers who actually paid for them.
The Backdrop: A Supreme Court Shake-up
The drama started on February 20, 2026, when the U.S. Supreme Court ruled that the sweeping worldwide tariffs imposed last year under the International Emergency Economic Powers Act (IEEPA) were unlawful. The Court found that the executive branch had overstepped its authority, effectively turning roughly $130 billion to $175 billion in collected duties into a massive pot of refundable money.
Immediately, over 2,000 companies—including Costco—filed their own lawsuits against the government to claw that money back.
The Conflict: “Double Recovery” vs. “Better Value”
The new consumer lawsuit, led by plaintiff Matthew Stockov, argues that Costco acted as a “pass-through vehicle.” The logic is simple:
- The Hike: Costco raised prices on electronics, household goods, and food to cover the cost of the tariffs.
- The Refund: Now that the tariffs are struck down, Costco is suing the government to get that money back.
- The “Double Dip”: If Costco keeps the refund and the extra money they already collected from shoppers via higher prices, the lawsuit alleges they are “unjustly enriched” at the expense of their members.
Costco CEO Ron Vachris recently addressed the situation, stating the company’s commitment is to return value to members through “lower prices and better values” in the future.
However, the lawsuit isn’t buying it. The legal team argues that a promise of future discounts for future shoppers doesn’t compensate the specific people who paid the “tariff tax” last year. They want direct restitution.
Is a Refund Actually Coming?
While the Supreme Court ruling is a win for importers, getting cash into the hands of individual shoppers is a legal uphill battle. Here is why:
- Standing: Under federal trade law, only the “importer of record” (Costco) has the legal right to claim a refund from the government.
- The Math: Proving exactly how much of a $0.50 price hike on a rotisserie chicken was due to a specific tariff vs. inflation or supply chain issues is a forensic accounting nightmare.
- The Contract: Legal experts note that when you buy an item, the “contract” is the price on the tag. Retailers generally aren’t legally obligated to refund you if their internal costs go down later.
What’s Next?
Costco isn’t the only one in the crosshairs. Similar suits have been filed against FedEx and EssilorLuxottica (the makers of Ray-Ban).
If the court certifies this as a class action, it could set a massive precedent for how “corporate windfalls” are handled after major policy reversals. For now, Costco members should keep their receipts—and their eyes on the Court of International Trade.
If Costco decides to fight this in court rather than settle, their legal team will likely lean on a defense built around retail economics and contract law.
Here are the four “pillars” of defense they are expected to use:
1. The “Commingled Costs” Argument
Retail pricing isn’t a simple $1+1=2$ equation. When Costco raises the price of a television, that hike accounts for shipping fuel, labor, warehouse rent, insurance, and tariffs. Costco will likely argue that it is mathematically impossible to isolate exactly how many cents of a price increase were “just” for the tariff. Since the costs were commingled, they may argue that specific “tariff surcharges” were never actually charged to the customer.
2. Lack of “Privity” (Direct Relationship)
In trade law, the “Importer of Record” is the only entity with a legal relationship to U.S. Customs.
- Costco’s stance: We paid the government; the government owes us.
- The logic: There is no contract between Costco and a member that promises to pass through government refunds. When you buy a jar of almond butter, you agree to the price on the tag at that moment, regardless of Costco’s internal cost fluctuations.
3. The “Future Value” Offset
CEO Ron Vachris has already hinted at this strategy. Costco may argue that they are already fulfilling their duty to members by using anticipated refunds to lower prices across the board today. By proving they are reinvesting the money into “better values,” they can claim they are not being “unjustly enriched”—the core requirement for the plaintiff to win.
4. Administrative Impossibility
Costco has over 130 million members. Tracking every single purchase of tariff-affected goods (from socks to patio furniture) over a multi-year period and issuing individual checks would be an administrative nightmare that could cost more than the refunds themselves. They may argue that a “cy-près” award (like a general price drop or a donation to a relevant cause) is a more legal and practical remedy than individual refunds.
Comparison of Arguments
| Argument | Plaintiff’s View (Shoppers) | Defense View (Costco) |
| Enrichment | Costco gets a “double recovery” (shoppers’ money + gov refund). | Costco is a low-margin business that “returns value” via lower future prices. |
| Pricing | Prices went up specifically because of tariffs. | Prices are set by market competition and total operating costs. |
| Equity | The specific people who paid the “tax” should get the cash. | It is impossible to track individual “tariff cents” per member. |
While Costco is currently the primary target of this specific class-action pressure, other major retailers like Walmart and Target are taking noticeably different approaches to the $175 billion tariff refund opportunity.
Here is how the other giants are positioning themselves:
1. Walmart: The “Conservative Pivot”
Walmart has been more cautious in its public statements regarding specific consumer refunds. Instead of promising direct returns, they are focusing on their role as a “price stabilizer.”
- The Strategy: During their recent February 2026 earnings call, Walmart leadership noted they are using their massive scale to absorb costs. Their official stance is that because they negotiate long-term contracts and used “inventory pull-forward” strategies to avoid the worst of the tariffs, they didn’t pass through costs as directly as others.
- The Defense: They are positioning any potential refunds as “capital for reinvestment” into their operations and employees, which they argue ultimately benefits customers through lower prices over the long term.
2. Target: The “Supplier Squeeze”
Target’s response has been more aggressive toward its supply chain rather than the federal government.
- The Strategy: Target made headlines earlier this year by reportedly asking its Chinese suppliers to absorb up to 50% of the tariff costs to keep shelf prices stable.
- The Stance: Because Target forced suppliers to eat much of the cost, they may argue that they aren’t the ones owed the full refund—or that since they didn’t raise prices as much as competitors, there is no “excess profit” to return to consumers.
3. FedEx & UPS: The “Direct Pass-Through” Exception
Unlike retailers where tariff costs are buried in the price of a gallon of milk, shipping companies like FedEx and UPS often used explicit line-item surcharges labeled as “Tariff Fees.”
- The Vulnerability: Because these fees were itemized, these companies are facing the most direct legal heat. FedEx has indicated in recent filings that if they receive refunds, they have a framework to pass them back to the original shippers, though the logistics of reaching the end consumer remain a “mess.”
Summary of Retailer Responses
| Retailer | Public Stance on Refunds | Primary Defense |
| Costco | “Future value” through lower prices and better deals. | Administrative impossibility of tracking individual cents. |
| Walmart | Focused on reinvesting refunds into business operations. | Scaled absorption—claims they didn’t pass through 1:1 costs. |
| Target | Silent on customer refunds; focused on supplier negotiations. | Argues suppliers bore the cost burden, not just the retailer. |
| FedEx | Exploring pass-throughs for itemized surcharges. | Contractual obligations to the “shipper of record.” |
Why the National Retail Federation (NRF) is Worried
The NRF, which represents all three of these companies, has called for a “seamless and automatic” refund process from the government. However, they are lobbying hard against the idea that retailers must “prove” they passed the money back to consumers, calling such requirements an “accounting nightmare” that would stall the economic boost the refunds are intended to provide.
While the lawsuit filed by Matthew Stockov seeks a blanket refund for “all affected products,” the actual legal battle centers on specific goods that were hit by the International Emergency Economic Powers Act (IEEPA) tariffs.
Because Costco sells such a wide variety of items, the impact is spread across several high-volume categories. Here are the product types most likely to be at the heart of the refund calculations:
1. Electronics and Accessories
This is a massive category for Costco and one of the hardest hit by the reciprocal tariffs.
- Small Tech: Laptop bags, charging cables, and power banks.
- Peripherals: Computer mice, keyboards, and monitors.
- Smart Home: Security cameras and small connected appliances.
- Note: Some major electronics (like certain computers) were protected under different trade laws, but “intermediate” components and accessories were often taxed at the full IEEPA rate.
2. Home Furnishings and Hard Goods
Furniture retailers have been among the first to join the “refund clamor.”
- Large Furniture: Sofas, dining sets, and patio furniture.
- Home Decor: Rugs, textiles, and lighting fixtures.
- Kitchenware: Cookware sets and small appliances (like air fryers or coffee makers) imported from affected regions.
3. Apparel and Footwear
These items saw some of the most significant price fluctuations over the last 12 months.
- Clothing: “Fast fashion” items, activewear, and outerwear.
- Shoes: Sneakers and boots, particularly those where the supply chain relies heavily on international sourcing.
4. Food and Intermediate Packaging
This is the most complex category for Costco to untangle.
- Imported Specialties: Specific wines, spirits, and olive oils that were subject to geopolitical surcharges.
- Packaging Costs: Even for “American-made” products, the tariffs often applied to the packaging (plastic containers, coffee filters, or baby wipe canisters) imported from abroad. Proving how a tariff on a plastic tub affected the price of the 5-pound tub of animal crackers is a key hurdle for the lawsuit.
What is NOT Included?
It’s important to note that many items at Costco were taxed under different laws (like Section 232 or Section 301), which the Supreme Court did not strike down. You likely won’t see refunds for:
- Steel and Aluminum products (including some appliances and car parts).
- Specific Chinese-made goods covered under long-standing trade war sections.
Summary Table: Refund Potential by Category
| Product Category | Refund Potential | Why? |
| Electronics Acc. | High | Many were hit with the 2025 “reciprocal” 10-25% tariffs. |
| Furniture | High | Home goods were a primary target for IEEPA-based levies. |
| Apparel | Medium | High volume, but often split between different tariff authorities. |
| Groceries | Low | Most food price hikes were tied to inflation/labor, not just tariffs. |
Learn how you could obtain some of your IEEPA Tariff Refund early
Contact Factoring Specialist, Chris Lehnes