Impact of Iran War Ripple through the Economy Due to Gas Prices
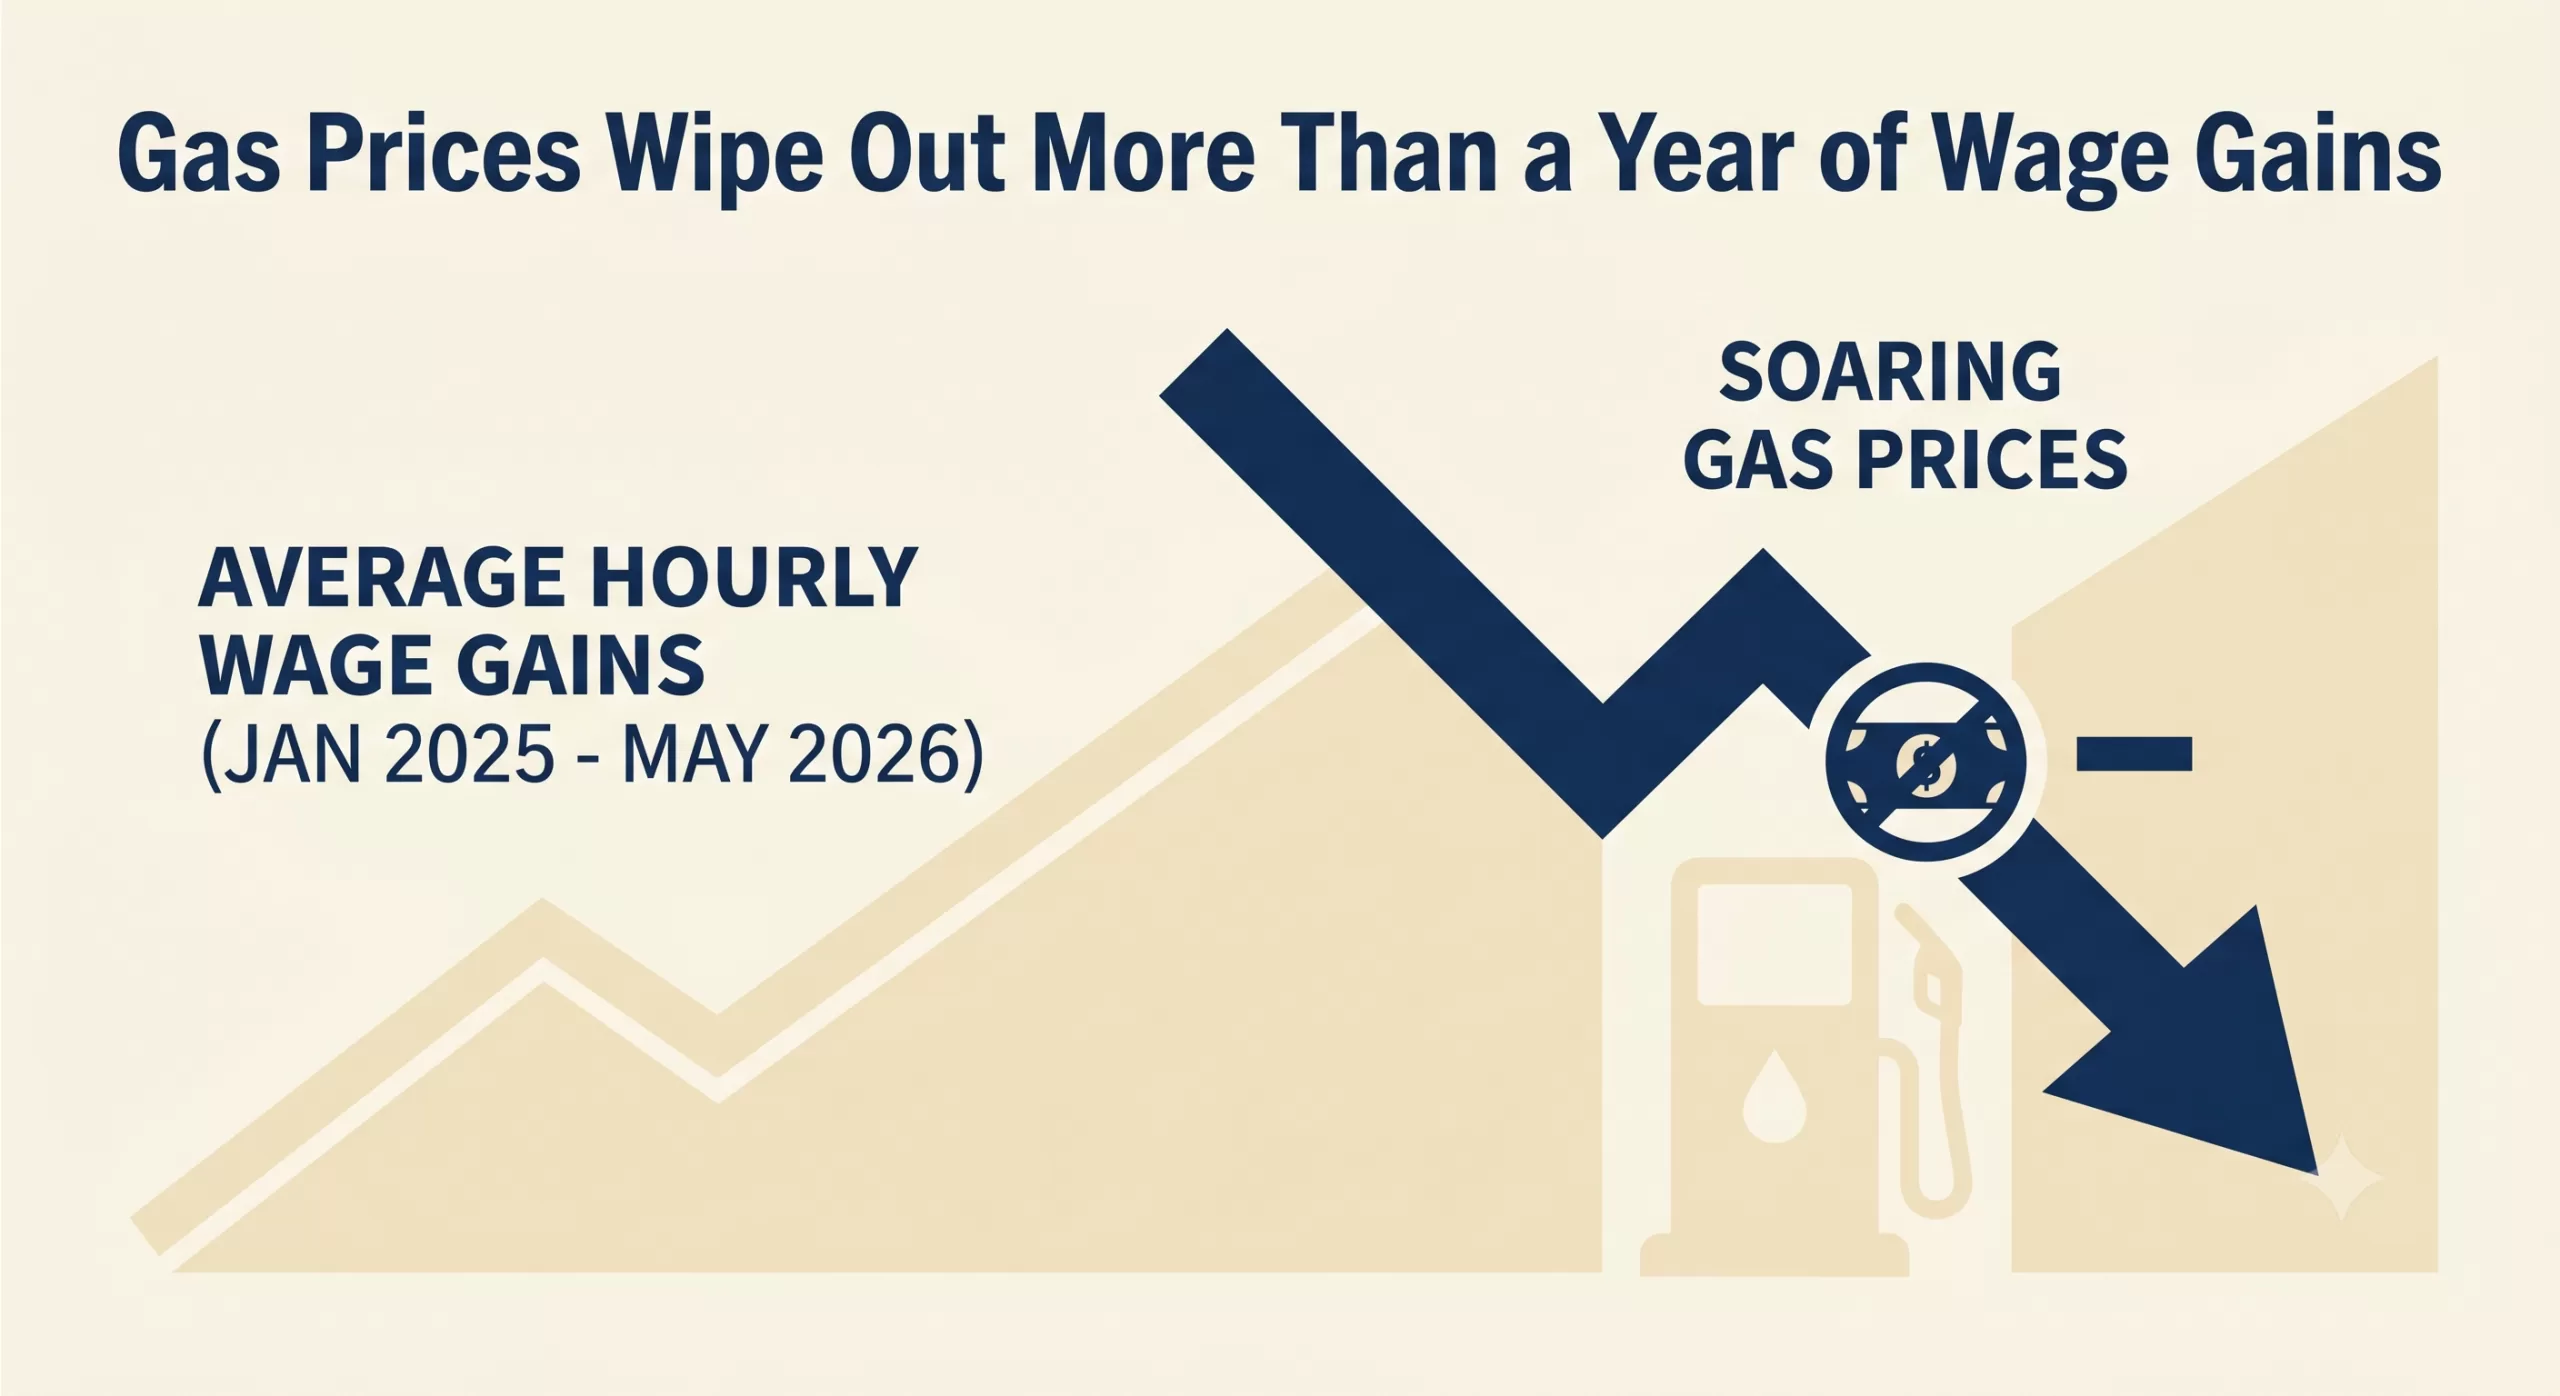
The latest macroeconomic indicators including gas prices paint a challenging picture for both consumers and businesses. Following the Labor Department‘s recent reports, it is clear that soaring energy costs have effectively neutralized recent progress in worker compensation. With top-line inflation advancing to 4.2% in May—the highest level in three years—and gasoline prices surging, real average hourly earnings have been pushed all the way back to January 2025 levels.

For the second consecutive month, inflation has outpaced wage growth. The reality is that gas prices have wiped out more than a year of wage gains.
The Macroeconomic Squeeze
The ripple effects of this inflationary spike are significant. The Federal Reserve now faces a complex policy dilemma as they weigh interest rate decisions against a backdrop of stubborn inflation and squeezed household budgets. When wages lag behind inflation, consumer spending inevitably cools, particularly among middle- and lower-income brackets who are forced to allocate a larger share of their take-home pay to essentials like fuel and groceries.
What This Means for Business Owners
While the headlines focus on the consumer at the pump, small and mid-sized businesses are absorbing these shocks on multiple fronts:
- Increased Operational Costs: Surging fuel prices directly inflate the cost of transportation, logistics, and supply chain operations.
- Margin Compression: Businesses face the difficult choice of passing higher costs onto increasingly price-sensitive consumers or absorbing the losses and shrinking their profit margins.
- Wage Pressure: Even though real wages are falling, nominal wage demands remain high as employees seek relief from the rising cost of living, straining payroll budgets.
Navigating the Cash Flow Crunch
During periods of high inflation and uncertain interest rates, liquidity becomes a paramount concern. Industries heavily reliant on steady cash flow—such as manufacturing, staffing, healthcare, and distribution—can find their working capital severely constrained when expenses rise faster than revenues can be collected.
Waiting 30, 60, or 90 days for clients to pay outstanding invoices is a luxury many companies cannot afford when the cost of doing business is escalating weekly. Accounts receivable factoring offers a strategic mechanism to bridge this gap. By converting outstanding B2B invoices into immediate working capital, business owners can cover rising operational costs, meet payroll obligations, and navigate economic volatility without taking on new debt or waiting on unpredictable macroeconomic shifts.
As we continue to monitor the inflation data and the Fed’s next moves, maintaining robust working capital will be the defining factor for businesses looking to weather this storm.