IEEPA Tariff While the Supreme Court invalidated the Administration’s ability to impose tariffs under IEEPA (International Emergency Economic Powers Act), it was deliberately silent with respect to refunds.
As the Administration’s stance is likely to be adversarial, it could take months if not years for businesses to receive IEEPA tariff refunds via conventional channels.
Prior to the Supreme Court Ruling, Hedge Funds were purchasing IEEPA tariff claims at an average of only 22% of the total claim due to the high risks involved. After the Ruling, due to mitigation of some of the uncertainty, they are currently purchasing claims at 75% of the refund amount. Rates are based on claim size and credit quality as tariff refund claims are not assignable. Importers with IEEPA tariff refund claims starting at $500,000 are eligible and there is no maximum limit. AES has monetized $20 million in refund claims since its involvement in brokering IEEPA tariff refund claims commenced 5 months ago. Clients include those in the food, seasonal decoration, apparel and home goods industries.
Instead of waiting 6, 12, 24 months or even longer to receive an IEEPA tariff refund, Hedge Funds can purchase claims within approximately 4 to 6 weeks depending on the quality of documentation assembled by the business.
How the Process of Selling an IEEPA Tariff Claim Works
Concept is: As an example, Company X has paid ($10 Million) in tariffs since April 7, 2025 Company X wants to de-risk prior to determination and finalization of the IEEPA tariff
Refund Process. Company X sells (50%, 100%, or some other percentage) of its tariff ‘claim’ to Buyer A in the form of a participation.
The Trade is nonrecourse to Company X as to the outcome of the Refund Process; but recourse to Company X only if the amount / validity of the claim is proven to be false, or too high.
Process for Selling IEEPA Tariff Claims: As an example, Company X has paid $10 million in IEEPA Tariffs.
Company X agrees to “sell” its tariff claim to Buyer for 75% of the claim amount, i.e. $7.5 million.
Buyer sends Seller a Confirm, and then ultimately a Participation Agreement which will govern the transaction. IMPORTANT – Company X retains its status as the “Plaintiff” / “Claimant” since these tariff claims are not transferable.
Buyer might ask Company X to commence litigation for the return of the IEEPA tariffs paid. The rationale for this is that it is possible that only those parties who have commenced actual litigation are entitled to refunds. Thus, Company X will need to commence litigation in order to receive their refund.
Buyer will continue to monitor the situation and inform Company X of developments. If and when the refund is received on the claim, Company X will receive the refund and forward to the Buyer.
Using an IEEPA Tariff Claim as Collateral for a Loan
In lieu of selling an IEEPA Tariff Claim at a discount, it is possible to use this claim as collateral for a term loan. This term loan would be on a “recourse: basis to the borrower.
The potential loan amount could be up to approximately 50% to 60% of the total IEEPA claim amount. However, the claim must exceed $20 million to qualify for a loan. The interest rate would be in the low to mid-teens.
Key Points Regarding the Sale: Company X (as seller of the Claim) must be a financially healthy enough counterparty for Buyer A to enter into what could be a 2-to-5-year process of obtaining the refund. Legal fees are split going forward based on risk percentage. If Company X sells 100% today, Buyer A will pay 100% of legal costs today.
Buyers are currently paying up to 75% to companies seeking to sell their IEEPA tariff claims. However, this is an evolving market and these percentages can either increase or decrease depending on the markets’ reaction to the Trump Administration’s expected obstructionism and the unresolved Court of International Trade’s procedural issues. Prior to the Supreme Court decision, buyers were purchasing tariff claims at an average of 22% due to the high risks involved.
We will be monitoring on a daily basis the rates at which Buyers are purchasing IEEPA claims and we will update our website accordingly. Feel free to email us to ascertain what the rate is on any particular day.
There would likely be an administrative process instituted such that companies that have paid these IEEPA tariffs will need to file special claims and wait to get refunded by the government. The process of receiving the refund payment from the government could take up to 2 to 5 years according to trade experts.
This details how investment firms are turning a legal and political mess into a new trading opportunity.
The situation stems from a recent Supreme Court ruling that tossed out several of President Trump’s sweeping tariffs. This has created a scramble for companies to claw back the levies they have already paid—estimated to be as high as $133 billion.
The Rise of “Claims Trading”: Large corporations (like retailers and manufacturers) that paid billions in tariffs are now selling the rights to their potential government refunds to Wall Street investors.
Why Companies Are Selling: Rather than waiting years for the government to process refunds or navigate complex litigation, companies are opting for immediate cash by selling their claims at a discount.
The Players: Specialist investment firms—including King Street Capital Management, Anchorage Capital Advisors, and Fulcrum Capital—are among those pouncing on these claims. They are betting that they can eventually collect the full refund from the Treasury, netting a significant profit.
Legal Uncertainty: The Supreme Court has not yet explicitly ruled on whether the government must issue refunds for the tariffs already collected. Despite this, investors are moving quickly to snap up these rights, treating them similarly to how they trade the debt of bankrupt companies.
The “Chaos” Factor: The process is currently a “long, drawn-out mess” with high administrative hurdles. Traders are effectively providing a “liquidity service” to companies that want the tariff money back on their balance sheets now rather than later.
In short, while the reversal of the tariffs has caused massive administrative and fiscal confusion for the government, Wall Street has identified it as a lucrative new asset class.
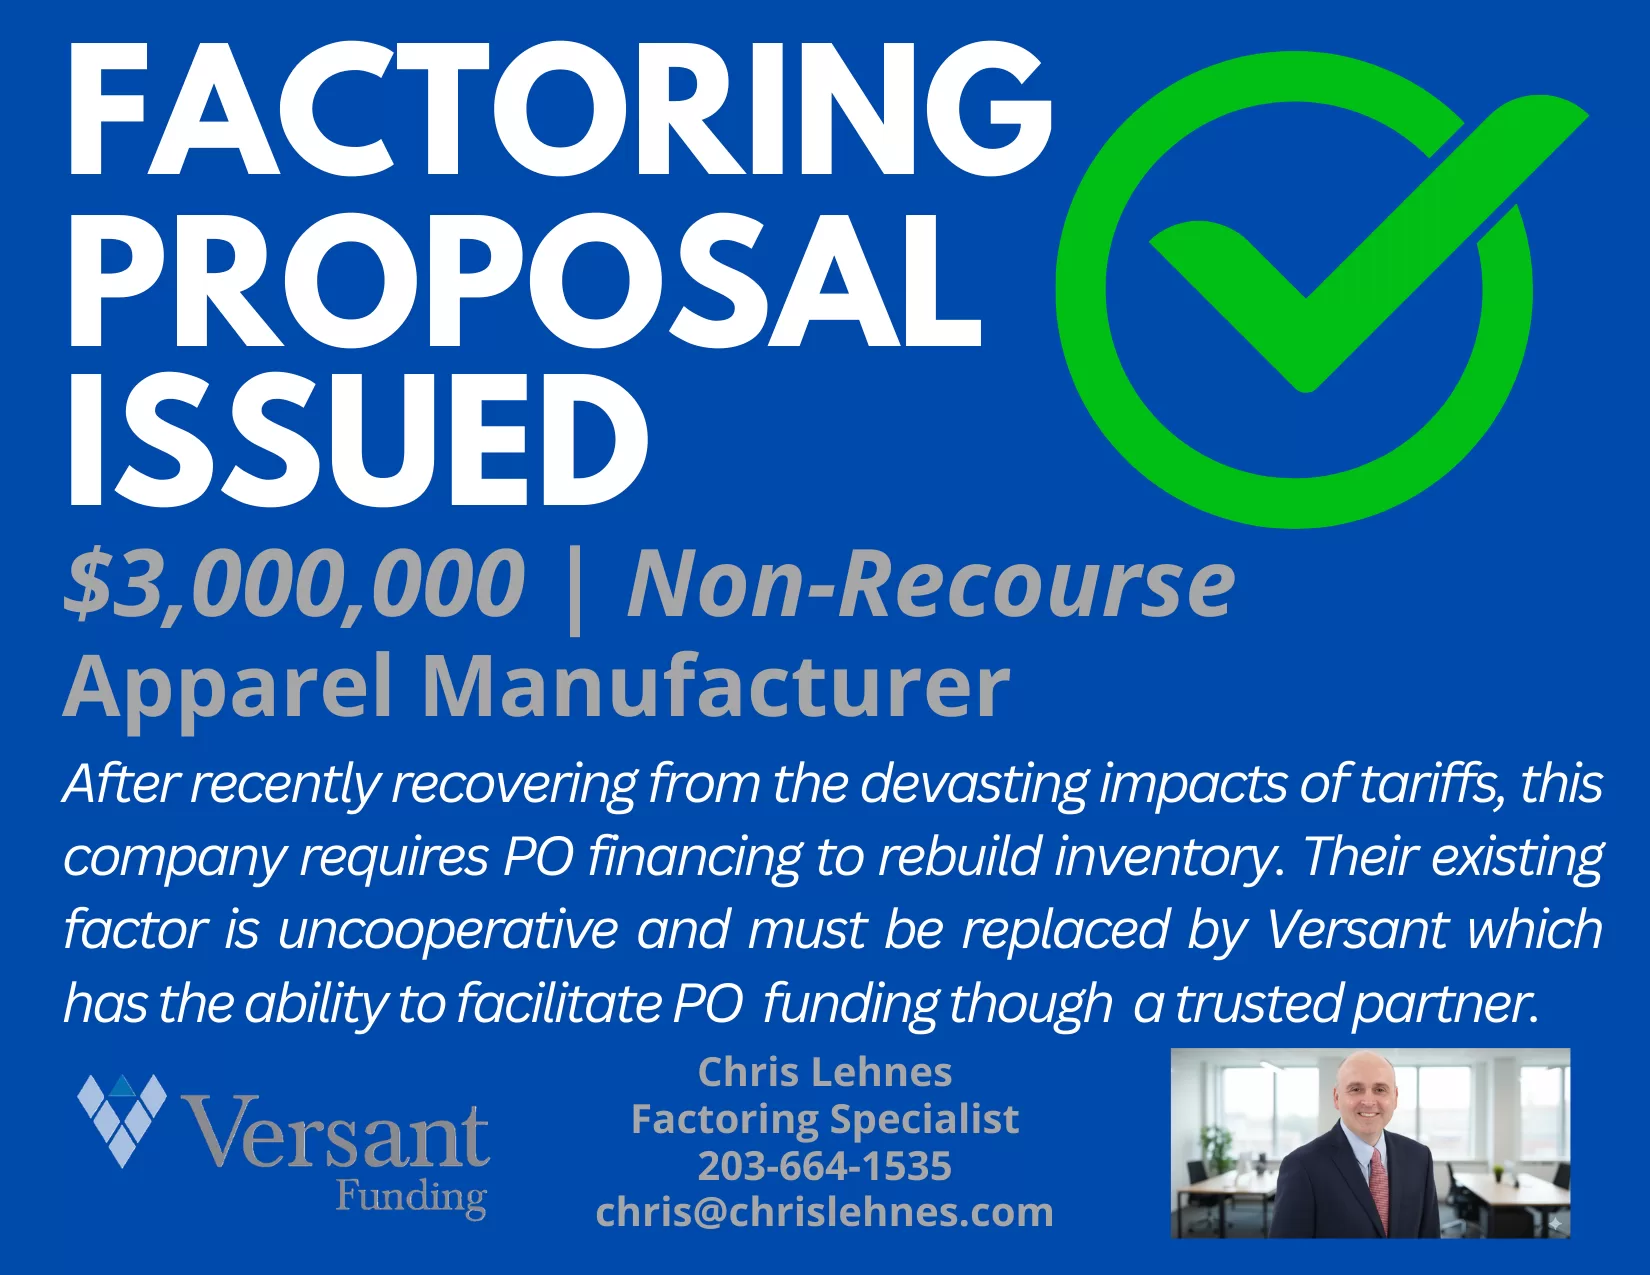
Factoring Proposal: After recently recovering from the devasting impacts of tariffs, this company requires PO financing to rebuild inventory. Their existing factor is uncooperative and must be replaced by Versant which has the ability to facilitate PO funding though a trusted partner.
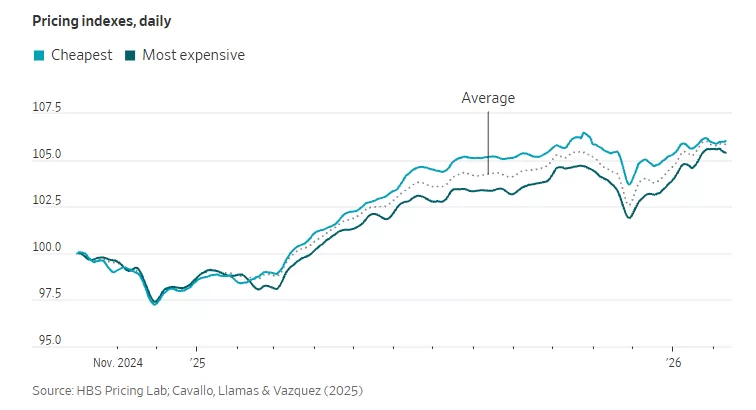
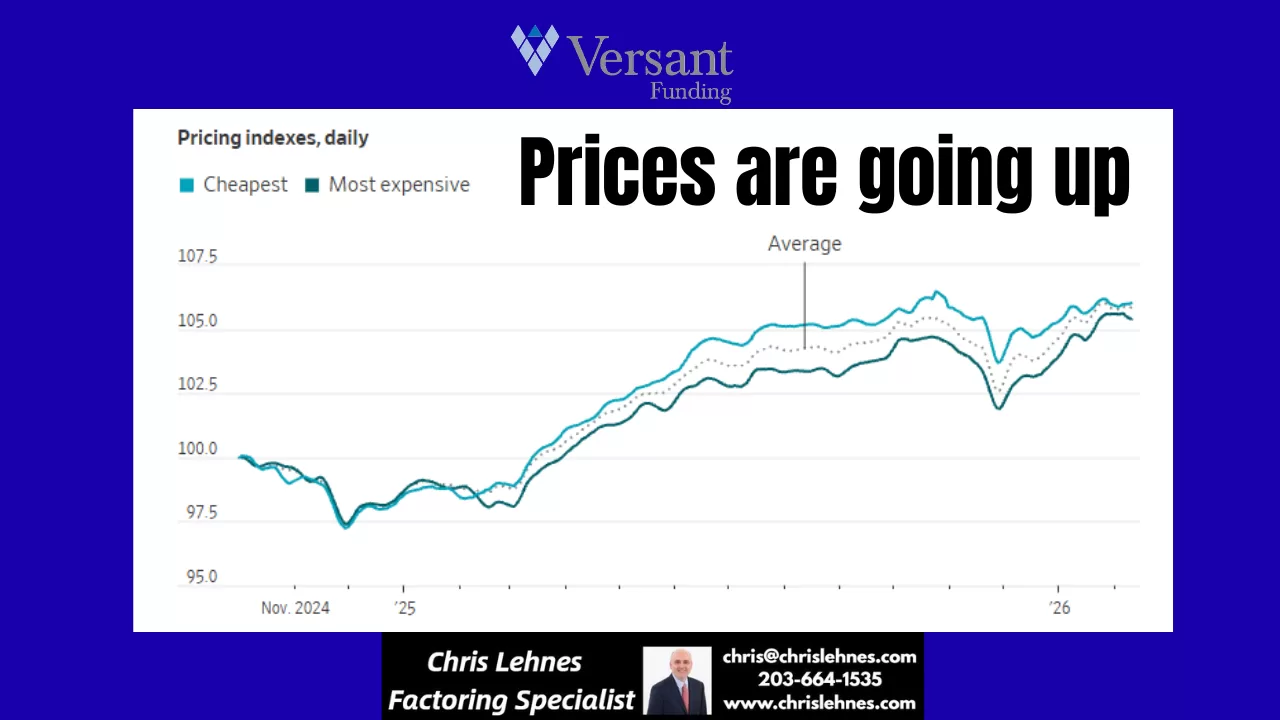
Remember that brief sigh of relief? The one where it felt like maybe, just maybe, the relentless march of price increases was slowing down? Well, if you’ve been to the grocery store, filled up your gas tank, or even just browsed online recently, you’ve probably noticed it: the break is over. Companies are jacking up prices again, and consumers are once again feeling the pinch.
For a while, many economists and analysts pointed to easing supply chain issues, stabilizing energy costs, and even a slight dip in consumer demand as potential signals that inflation was cooling. Some businesses even held the line on prices, perhaps hoping to retain market share or out of a genuine desire to give their customers a break.
But those days seem to be largely behind us. We’re seeing a resurgence in price hikes across a wide array of sectors. From everyday necessities to discretionary items, the numbers on the tags are climbing.
What’s Driving This Latest Surge?
Several factors are likely contributing to this renewed upward trend:
Persistent Input Costs: While some raw material costs have stabilized, others continue to be elevated. Labor costs are also a significant factor, with many businesses facing pressure to offer higher wages to attract and retain employees. These increased operational expenses often get passed on to the consumer.
Strong Consumer Demand (Still): Despite earlier predictions of a significant slowdown, consumer demand has proven remarkably resilient in many areas. When demand remains high, businesses have less incentive to lower prices and more leeway to raise them.
“Catch-Up” Pricing: Some companies might feel they absorbed increased costs for a period and are now playing catch-up, adjusting prices to reflect their sustained operational expenses.
Geopolitical Factors: Global events continue to create volatility in commodity markets, particularly for energy and certain raw materials, which inevitably impacts production and transportation costs.
Profit Margins: Let’s be honest, businesses are in the business of making a profit. If they perceive an opportunity to increase their margins without significantly impacting sales volume, many will take it.
What Does This Mean for You?
For the average household, this renewed wave of price increases means a continued squeeze on budgets. Discretionary spending may need to be curtailed further, and even essential purchases will require more careful planning. Savings might deplete faster, and the goal of financial stability could feel increasingly distant.
How Can Consumers Cope?
While we can’t control the broader economic forces at play, there are strategies consumers can employ to mitigate the impact:
Become a Savvy Shopper: Compare prices diligently, look for sales and discounts, and consider generic or store-brand alternatives.
Budgeting is Key: Revisit your budget and identify areas where you can cut back. Track your spending to understand exactly where your money is going.
Prioritize Needs vs. Wants: Distinguish between essential purchases and items that can be deferred or eliminated.
Support Local (Where Affordable): Sometimes local businesses, with lower overheads, can offer competitive pricing, or at least you’re supporting your community.
Advocate for Yourself: When possible, negotiate prices for services, or look for loyalty programs that offer discounts.
The “break” from rising prices was indeed short-lived. As companies continue to adjust their pricing strategies, it’s more important than ever for consumers to be vigilant, adapt their spending habits, and advocate for their financial well-being.
In a surprising turn of events, German factory orders in have shown an unexpected and robust surge, signaling a potentially stronger-than-anticipated rebound in the nation’s industrial sector. This latest data has instilled a renewed sense of optimism among economists and policymakers, suggesting that Europe’s largest economy might be on a more solid recovery path than previously estimated.
The Federal Statistical Office announced this morning that new factory orders jumped by a significant margin in the past month, far exceeding analyst expectations. This remarkable uptick follows a period of cautious growth and even some contractions, making the current surge all the more impactful. The increase was broad-based, with both domestic and international orders contributing substantially to the overall rise.
A Deeper Dive into the Numbers
The reported increase in orders was particularly driven by strong demand for capital goods, indicating that businesses are investing more in machinery and equipment – a key indicator of future production capacity and confidence. Intermediate goods also saw a healthy boost, suggesting renewed activity across various supply chains.
Economists are pointing to several factors contributing to this positive development. A resilient global demand, particularly from key trading partners, appears to be playing a significant role. Furthermore, a gradual easing of supply chain bottlenecks, which have plagued manufacturers for months, is allowing companies to fulfill orders more efficiently and take on new business.
Impact on the Broader Economy
This unexpected surge in factory orders is a shot in the arm for the German economy, which has been grappling with persistent inflation and the lingering effects of global uncertainties. A strong industrial sector is crucial for Germany’s economic health, as it is a major employer and a significant contributor to GDP. The improved outlook could lead to increased hiring, higher wages, and ultimately, stronger consumer spending.
Every February, Americans look forward to a Monday off, often marked by mattress sales and cherry pie. But the story of Presidents’ Day is more than just a break from work; it’s a quirky evolution of federal law, calendar shifting, and a bit of a tug-of-war between two of America’s most famous leaders.
It Started with George
Originally, this holiday had nothing to do with “Presidents” in the plural. It was strictly about George Washington.
After his death in 1799, his birthday (February 22) became a day of unofficial remembrance. By 1879, it became an official federal holiday for government workers in Washington, D.C., and by 1885, it expanded to the entire country. For decades, the logic was simple: Washington was the “Father of His Country,” so he got the day.
The Great Calendar Shift: The Uniform Monday Holiday Act
If you’re wondering why we never seem to celebrate on Washington’s actual birthday anymore, you can thank the late 1960s.
In 1968, Congress passed the Uniform Monday Holiday Act. The goal was practical, if a bit unromantic: move several federal holidays to predetermined Mondays to create more three-day weekends for the workforce.
The Goal: Boost industrial productivity by reducing mid-week disruptions and encourage consumer spending through long weekend travel and shopping.
When the law took effect in 1971, Washington’s Birthday was moved to the third Monday in February. Ironically, because of how the calendar falls, the holiday now never actually lands on Washington’s real birthday (February 22).
The “Lincoln” Factor
While Washington had the federal holiday, many states (especially in the North) also celebrated Abraham Lincoln’s birthday on February 12.
When the 1971 shift happened, there was a push to rename the day “Presidents’ Day” to honor both men—and eventually, all who served in the office. While the federal government still officially calls it “Washington’s Birthday,” the popular name “Presidents’ Day” took over the public consciousness by the mid-1980s, largely driven by retailers who found “Presidents’ Day Sales” to be a much more effective marketing tool.
How We Celebrate Today
Today, the holiday is a bit of a “choose your own adventure” for the 50 states:
Traditionalists: Some states still officially list it as “Washington’s Birthday.”
The Duo: Others, like Illinois, place a heavy emphasis on Lincoln.
The Inclusive: Most people treat it as a day to reflect on the presidency as an institution and the various leaders who have occupied the Oval Office.
Whether you’re spending the day studying Revolutionary War history or just catching up on sleep, you’re participating in a tradition that has evolved from a somber tribute into a celebration of American leadership.
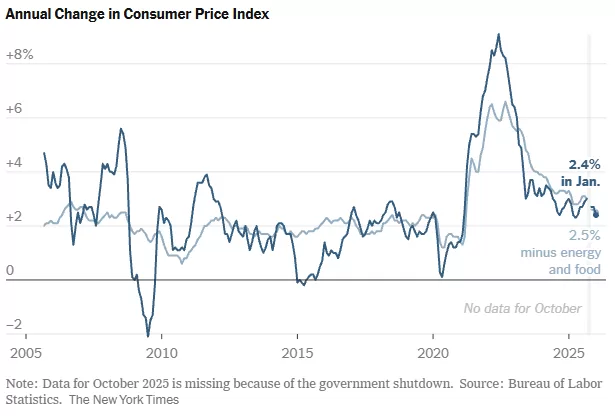
The latest economic data brings a sigh of relief for consumers and policymakers alike, as U.S. inflation has shown a more significant easing than anticipated at the beginning of the year. This positive development suggests that efforts to tame rising prices may be gaining traction, offering a glimmer of hope for greater economic stability in the months to come.
For much of the past year, inflation has been a persistent headwind, impacting everything from grocery bills to housing costs. The robust labor market, while a sign of economic strength, also contributed to upward price pressures. However, recent reports indicate a potential shift in this trend.
Several factors appear to be contributing to this welcome slowdown. Supply chain disruptions, which were a major catalyst for price increases, have largely improved. This has allowed for a more consistent flow of goods, reducing bottlenecks and associated costs. Additionally, the Federal Reserve’s aggressive monetary policy, including multiple interest rate hikes, seems to be having its intended effect of cooling demand and reining in inflationary expectations.
While the easing of inflation is certainly good news, it’s important to maintain a balanced perspective. The economy is a complex system, and various forces are constantly at play. Energy prices, geopolitical events, and shifts in consumer spending habits can all influence the trajectory of inflation. Therefore, continuous monitoring and adaptive policymaking will remain crucial.
What does this mean for the average American? For starters, it could translate into less pressure on household budgets over time. If the trend continues, we might see more stable prices for everyday goods and services, allowing purchasing power to stretch further. It also provides the Federal Reserve with more flexibility in its future policy decisions, potentially reducing the need for further aggressive rate hikes.
The journey to sustained price stability is an ongoing one, but the early signs from this year are undoubtedly encouraging. It’s a testament to the resilience of the U.S. economy and the effectiveness of concerted efforts to address inflationary pressures. As we move further into the year, economists and consumers alike will be watching closely to see if this promising trend continues, paving the way for a more predictable and stable economic environment.
Home Sales Take a January Dip: What Does It Mean for the Market?
The housing market, often a dynamic and unpredictable beast, just delivered a notable headline: home sales in January experienced their most significant monthly decline in nearly four years. This news might spark a bit of anxiety for some, and perhaps a glimmer of hope for others. But what’s truly behind this downturn, and what could it signal for the months ahead?
According to recent reports, the seasonally adjusted annual rate of existing home sales saw a substantial drop last month. This marks a notable shift after a period where the market showed some signs of stabilizing, or even modest recovery, in late 2023.
What’s Driving the Decline?
Several factors are likely at play in this January slump:
Mortgage Rate Volatility: While rates have come down from their peaks, they’ve also experienced some upward swings, creating uncertainty for prospective buyers. Higher rates directly impact affordability, pushing some buyers to the sidelines.
Persistent Inventory Shortages: Despite the dip in sales, the fundamental issue of low housing inventory remains a significant challenge in many areas. Fewer homes on the market mean less choice for buyers, and can still keep prices elevated, even with softening demand.
Seasonal Slowdown (Exacerbated): January is typically a slower month for real estate activity due to holidays and winter weather. However, the magnitude of this decline suggests more than just a typical seasonal lull. It could indicate that underlying market pressures are intensifying.
Affordability Challenges: The combination of elevated home prices and higher interest rates continues to stretch buyer budgets thin. For many, especially first-time homebuyers, the dream of homeownership remains a distant one.
Economic Uncertainty: Broader economic concerns, even if subtle, can influence consumer confidence. Worries about inflation, job security, or a potential recession can lead people to postpone major financial decisions like buying a home.
Is This the Start of a Larger Trend?
It’s crucial not to jump to conclusions based on a single month’s data. Real estate markets are complex and influenced by numerous variables. However, a decline of this magnitude certainly warrants close attention.
Potential for Price Adjustments: A sustained drop in demand, particularly if inventory levels begin to rise, could eventually lead to more significant price corrections in some markets. Buyers who have been waiting for prices to come down might see this as a positive sign.
Opportunity for Buyers? For those who are financially secure and ready to buy, a less competitive market could present opportunities. Fewer bidding wars and potentially more negotiating power could be on the horizon if the trend continues.
Impact on Sellers: Sellers might need to adjust their expectations. Pricing strategically and ensuring homes are in top condition will become even more critical in a market where buyers have more leverage.
Looking Ahead
The coming months will be telling. We’ll need to watch several key indicators:
Mortgage Rate Movements: Any significant and sustained drop in interest rates would likely bring buyers back into the market.
Inventory Levels: A notable increase in homes for sale would help alleviate pressure and potentially lead to more balanced market conditions.
Economic Data: Broader economic health, including inflation and employment figures, will continue to play a role in consumer confidence and housing demand.
While January’s numbers present a cautious start to the year for the housing market, they also highlight the ongoing adjustments and recalibrations happening. Whether this dip is a temporary blip or a harbinger of more significant changes remains to be seen, but it’s a clear reminder that the real estate landscape is always evolving.
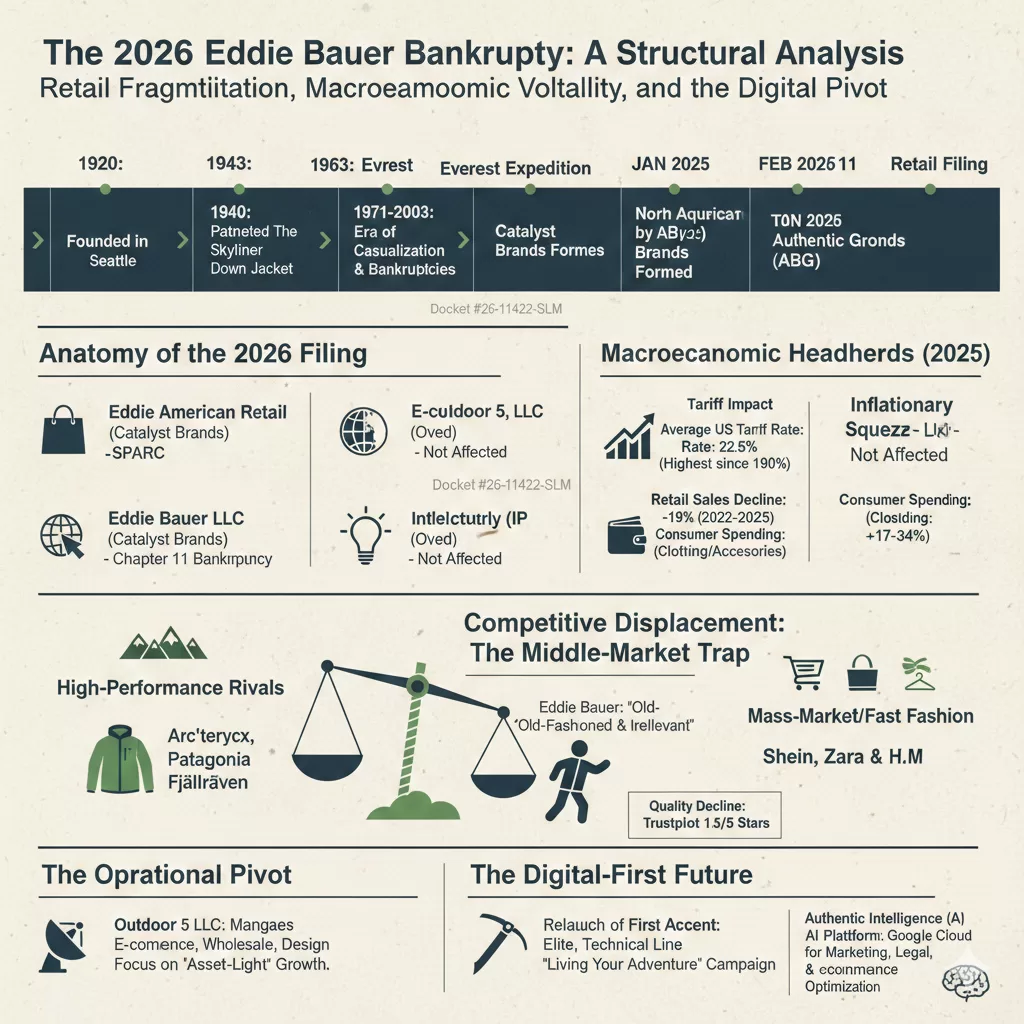
The 2026 Bankruptcy of Eddie Bauer: A Structural Analysis of Retail Fragmentation, Macroeconomic Volatility, and the Demise of the Traditional Outfitter
The voluntary filing for Chapter 11 bankruptcy protection by Eddie Bauer LLC on February 9, 2026, represents more than a singular corporate failure; it serves as a definitive case study in the structural fragmentation of legacy retail in the mid-2020s. This move, marking the third time the 106-year-old brand has sought creditor protection in a little over two decades, is the culmination of a sophisticated strategic carve-out executed within the complex ecosystem of modern brand management. While the physical store operations, housed under the Catalyst Brands umbrella, undergo a court-supervised wind-down or potential sale, the brand’s intellectual property, e-commerce, and wholesale divisions have been insulated from the filing. This analysis explores the causal mechanisms behind the 2026 filing, the macroeconomic headwinds of the preceding year, the competitive displacement of the brand, and the bifurcated future of the Eddie Bauer name in a digital-first economy.
The Anatomy of the 2026 Bankruptcy Filing
The filing in the United States Bankruptcy Court for the District of New Jersey under docket #26-11422-SLM specifically targets the retail operator of approximately 180 Eddie Bauer stores across the United States and Canada. The financial distress reported by the company is severe, with court documents indicating liabilities that could range from $1 billion to as high as $10 billion, set against assets valued at only $100 million to $500 million. At the time of the filing, the retail entity faced a critical liquidity crisis, reporting average weekly disbursements of approximately $1.6 million against a cash reserve of only $20 million.
A defining feature of this bankruptcy is its targeted scope. The Chapter 11 proceedings do not include Eddie Bauer’s e-commerce platforms, wholesale operations, manufacturing divisions, or international locations outside of North America. This structural insulation was achieved through a series of tactical transfers occurring just weeks before the filing. In January 2026, Authentic Brands Group (ABG), the owner of the Eddie Bauer intellectual property, transitioned the licenses for e-commerce and wholesale to a separate entity, Outdoor 5 LLC (Oved), effective February 2, 2026. This maneuver effectively separated the profitable digital and wholesale channels from the debt-burdened physical retail footprint, leaving the latter to navigate the bankruptcy process as a standalone entity.
Operational Segment
Entity Responsible (Feb 2026)
Bankruptcy Status
North American Retail Stores
Eddie Bauer LLC (Catalyst Brands)
Chapter 11 Filing
E-commerce & Digital Sales
Outdoor 5, LLC (Oved)
Not Affected
Wholesale & Manufacturing
Outdoor 5, LLC (Oved)
Not Affected
Intellectual Property (IP)
Authentic Brands Group (ABG)
Not Affected
International Operations
Various International Licensees
Not Affected
The retail operator entered into a Restructuring Support Agreement (RSA) with its secured lenders to facilitate what it calls a “dual-path” process. This strategy involves conducting immediate liquidation sales across its North American fleet while simultaneously seeking a “going concern” buyer for the physical store operations. If a suitable buyer is not secured by the court-mandated deadline of March 12, 2026, the company will proceed with an orderly total wind-down of its U.S. and Canadian brick-and-mortar presence by April 30, 2026.
Macroeconomic Catalysts: The 2025 Trade Regime and Inflationary Squeeze
While the internal structural issues of Eddie Bauer were longstanding, the “final blow” came from a series of macroeconomic shocks throughout 2025 that the company’s overleveraged business model could not absorb. CEO Marc Rosen of Catalyst Brands explicitly cited “ongoing tariff uncertainty” and persistent inflation as the primary accelerators of the retailer’s demise.
The 2025 Tariff Impact on the Apparel Sector
The trade environment of 2025 was characterized by aggressive new tariffs that fundamentally altered the cost structure of North American retail. Research from the Yale Budget Lab indicates that the overall average effective U.S. tariff rate reached 22.5 percent in 2025—the highest level recorded since 1909. These tariffs disproportionately targeted categories central to Eddie Bauer’s product mix, including apparel, footwear, and leather products.
Commodity Category
Short-Run Price Increase (2025)
Long-Run Projected Increase
General Apparel
17.0% – 34.0%
11.0% – 13.0%
Leather Products & Footwear
36.0% – 37.0%
12.0% – 13.0%
Textiles
21.0%
7.0%
These cost increases were rapidly passed on to consumers, pushing key price thresholds beyond what casual outdoor enthusiasts were willing to pay. For a brand like Eddie Bauer, which operated in the “middle-of-the-road” value segment, the inability to absorb these costs led to a significant collapse in discretionary spending. Data from Earnest Analytics revealed a 3.9 percent year-over-year drop in consumer spending at clothing and accessories establishments in early 2025, making it the worst-performing major retail segment of the year.
Inflationary Pressures and Consumer Sentiment
The residual effects of post-pandemic inflation further squeezed the profit margins of physical retail operations. Eddie Bauer’s retail sales saw a precipitous 19 percent decline between 2022 and 2025, driven by the increased cost of doing business and shifting consumer priorities. A survey conducted by Circana in October 2025 revealed that 38 percent of consumers intended to cut back on spending specifically due to tariff-induced price hikes, with clothing and footwear identified as the primary targets for reduced purchases. The combination of rising labor costs, increased rent in premium mall locations, and the higher cost of imported goods created a “sustained period of negative earnings” that ultimately made the retail entity unsustainable.
The Strategic Formation of Catalyst Brands
The formation of Catalyst Brands in January 2025 was an ambitious attempt to stabilize several struggling heritage labels through the economies of scale. This joint venture was created through the merger of SPARC Group—the operating partner for brands like Aéropostale, Brooks Brothers, Lucky Brand, and Nautica—and JCPenney. The venture brought together a portfolio of six iconic retail banners with combined annual revenue exceeding $9 billion.
The ownership structure of Catalyst Brands reflects a partnership between major mall landlords and brand management firms, including Simon Property Group, Brookfield Corporation, Authentic Brands Group, and Shein. This alliance was designed to leverage a robust distribution network of 1,800 store locations and 60,000 employees, with the hope that shared design, sourcing, and logistics capabilities would drive operational efficiencies.
Brand
Year Acquired by Catalyst/Predecessor
Original Founding Year
Eddie Bauer
2021 (by SPARC)
1920
Brooks Brothers
2020 (by SPARC)
1818
JCPenney
2020 (by Simon/Brookfield)
1902
Nautica
2018 (by SPARC)
1983
Aéropostale
2016 (by SPARC)
1987
Lucky Brand
2020 (by SPARC)
1990
Despite having $1 billion in liquidity at its launch, Catalyst Brands inherited a “challenged situation” at Eddie Bauer. Marc Rosen, the CEO of Catalyst Brands, noted that while the leadership team made significant strides in product development and marketing over the first year of the venture, these improvements could not be implemented fast enough to address the structural problems created over several decades. The bankruptcy of the Eddie Bauer retail operator suggests that the “zombie mall store” strategy—where landlords acquire their tenants to maintain occupancy—may have reached its financial limits in the face of the 2025-2026 economic headwinds.
Historical Context: The Erosion of a Technical Identity
The collapse of Eddie Bauer’s retail operations marks a stark departure from the brand’s origins as a premier technical outfitter. Founded by outdoorsman Eddie Bauer in Seattle in 1920, the company was responsible for some of the most significant innovations in outdoor gear of the 20th century.
The Legacy of Innovation (1920–1968)
Eddie Bauer’s early history was defined by a commitment to high-performance products, often developed out of personal necessity. After suffering hypothermia during a winter fishing trip, Bauer sought an alternative to heavy, water-logged wool garments. This led to the 1940 patent of “The Skyliner,” the first quilted goose-down-insulated jacket in the United States. This technical expertise earned the company massive government commissions during World War II, during which it manufactured over 50,000 B-9 Flight Parkas and 100,000 sleeping bags for the military. Notably, Eddie Bauer was the only government supplier granted permission to affix its logo to military-issue products.
This era of technical dominance culminated in the 1963 American Mount Everest Expedition, where Jim Whittaker wore Eddie Bauer gear to become the first American to summit the world’s highest peak. The brand’s creed—”To give you such outstanding quality, value, service and guarantee that we may be worthy of your high esteem”—was established during this period of innovation.
The Shift to Casual Apparel and Serial Ownership (1968–2021)
The retirement of Eddie Bauer in 1968 signaled the beginning of a decades-long transition from technical specialist to casual lifestyle brand. Successive ownership changes each prioritized different financial and market strategies, often at the expense of the brand’s performance-oriented heritage.
General Mills Era (1971–1988): Under the ownership of the food conglomerate, Eddie Bauer expanded its retail footprint to 60 stores and increasingly focused on casual apparel and home furnishings.
Spiegel Era (1988–2003): The brand underwent massive expansion but was dragged into bankruptcy along with its parent company in 2003.
Golden Gate Capital Era (2009–2021): After a second bankruptcy in 2009, private equity firm Golden Gate Capital acquired the brand, often focusing on cost-cutting measures and the expansion of the outlet channel.
By the time Authentic Brands Group acquired the brand in 2021, the product line had become “middle-of-the-road,” struggling to differentiate itself in an increasingly specialized market.
Competitive Displacement: The “Middle-Market Trap”
By 2025, the outdoor apparel market had become highly polarized, with consumers gravitating toward either high-performance specialist brands or trendy, low-cost athleisure. Eddie Bauer found itself caught in a “middle-market trap,” lacking the elite technical credibility of its high-end rivals while being unable to compete on price with mass-market discount retailers.
Technical Rivals and Brand Identity
Competitors such as Arc’teryx, Patagonia, and Fjällräven successfully built distinct identities that resonated with younger, tech-savvy consumers. While Eddie Bauer’s brand name remained well-known, it was increasingly perceived by younger shoppers as “old-fashioned and a bit irrelevant”.
Brand
Market Positioning
Key Strategy / Point of Difference
Arc’teryx
Elite Technical
Focus on alpine performance and “tech-wear” aesthetics
Patagonia
Activist / Heritage
Commitment to environmentalism and free lifelong repairs
Fjällräven
Trendy / Functional
Distinctive aesthetics and G-1000 material durability
Eddie Bauer
Traditional Casual
Reliance on outlets and perpetual 40% off discounting
The Decline of Quality and Service
A critical factor in Eddie Bauer’s loss of market share was a perceived decline in product quality. For an outdoor brand, whose value is intrinsically tied to the performance of its gear, this deterioration was particularly damaging. Industry analyst Neil Saunders of GlobalData Retail noted that the brand had not kept pace with the innovation cycles of its rivals.
By 2025, consumer sentiment reflected a significant loss of trust. Trustpilot ratings for the brand languished at 1.3 out of 5 stars, with shoppers citing frequent order errors, poor customer service, and materials that were “not like they used to be”. Furthermore, the watering down of the brand’s once-famous lifetime guarantee to a limited return policy in the mid-2010s had eroded a primary pillar of its customer loyalty.
Operational Fragmentation: The Digital Pivot and “Outdoor 5”
The 2026 bankruptcy of the retail operator must be viewed in the context of a broader shift toward an asset-light, digital-first business model. By carving out the profitable e-commerce and wholesale segments, Authentic Brands Group and its partners have essentially insulated the future of the Eddie Bauer brand from the failure of its physical stores.
The Role of Outdoor 5 LLC (Oved)
In January 2026, Outdoor 5 LLC (Oved) assumed responsibility for Eddie Bauer’s e-commerce, wholesale, design, and product development operations across the United States and Canada. Oved, a longtime partner of the brand for over two decades, brings specific expertise in the outdoor and performance apparel space. The company also manages other prominent brands in the Authentic portfolio, including Billabong, Quiksilver, and Hurley.
The strategic goal of this partnership is to align the brand’s channel mix with modern shopping behaviors. Authentic Brands Executive Vice President David Brooks noted that this approach provides the brand with greater flexibility, broader consumer access, and a more capital-efficient path to growth. By focusing on digital and wholesale channels, the brand can maintain its market presence while avoiding the high fixed costs associated with a 180-store physical retail fleet.
The Return of First Ascent
To revitalize the brand’s technical credibility, the new strategy centers on the relaunch of First Ascent, Eddie Bauer’s elite, performance-tested line. Originally developed for elite outdoor pursuits, the First Ascent collection features advanced technical specifications, including:
Waterproofing and taped seams.
High breathability and wind resistance.
800-fill down insulation.
The Spring 2026 campaign, “Living Your Adventure,” aims to integrate these high-performance features into the core brand offering, appealing to both serious adventurers and everyday outdoor enthusiasts. This return to technical roots is a direct response to the brand dilution that occurred during years of mall-dependent, casual-focused ownership.
Technological Integration: Authentic Intelligence and AI
A key component of the brand’s survival strategy in 2026 is the adoption of cutting-edge technology to drive efficiency and consumer engagement. Authentic Brands Group has partnered with Google Cloud to implement “Authentic Intelligence,” a proprietary AI platform built on Google’s Gemini and Vertex AI infrastructure.
This AI integration is being deployed across the brand’s operational spectrum to “supercharge collaboration and creativity” :
Marketing & Creative: AI-enhanced ad creative for brands in the portfolio has delivered up to 60 percent higher return on ad spend (ROAS) compared to traditional imagery.
Business Development: AI agents are used to build comprehensive profiles of potential licensing partners and accelerate lead generation.
Legal & Licensing: “Authentic Intelligence” assists with the rapid review and analysis of contracts, ensuring accuracy and faster turnaround times.
Digital Experience: Through a partnership with Pattern Group, the brand is expanding its presence on emerging platforms like TikTok Shop, utilizing AI-powered platforms to optimize conversion at scale.
This digital-first, data-driven approach is intended to provide clearer visibility into supply and demand, improve coordination across licensing partners, and ensure that the brand remains relevant in an environment that moves faster than traditional retail cycles.
Implications for Stakeholders: Landlords, Vendors, and Employees
The bankruptcy and potential wind-down of 180 physical store locations have immediate and severe consequences for the various stakeholders tied to the retail entity.
Landlord Risk and the “Dark Store” Threat
For shopping center owners, the filing by Eddie Bauer LLC creates significant operational and financial disruption. The company’s presence in approximately 180 locations means that landlords must navigate the risk of permanent vacancies. Key concerns for landlords include:
Lease Uncertainty: The uncertainty regarding whether the company will choose to assume or reject specific leases during the restructuring.
Co-tenancy Clauses: The closure of a prominent tenant like Eddie Bauer can trigger co-tenancy clauses in the leases of other tenants, allowing them to pay reduced rent or terminate their own leases.
Administrative Expenses: Landlords may face disruptions in rent payments and challenges regarding the recovery of administrative expenses during the bankruptcy process.
Vendor Exposure and Trade Credit
The fragmented corporate structure of Eddie Bauer creates a complex risk profile for vendors. Because the Chapter 11 filing only involves the store-operator entity, trade creditors must carefully identify which legal entity owes their outstanding invoices. Creditors of the retail operator may find their recoveries limited, as the most valuable assets—the intellectual property and the digital sales platforms—are held by entities not included in the bankruptcy proceedings.
Employee Impact
The potential closure of up to 180 retail locations puts thousands of jobs at risk across North America. While some employees involved in design and e-commerce may be absorbed by Outdoor 5 LLC as they scale their operations, the bulk of the retail staff faces the prospect of permanent displacement if a “going concern” buyer for the physical stores is not found by March 2026.
Conclusion: The Finality of the Mall-Based Era
The 2026 bankruptcy of Eddie Bauer’s retail operator represents the final chapter of the brand’s 106-year relationship with traditional American brick-and-mortar retail. The failure of the physical store model under Catalyst Brands is a clear signal that the combination of heavy debt, mall dependence, and macroeconomic volatility is no longer sustainable for heritage mid-market labels.
While the physical stores are being liquidated, the Eddie Bauer name itself is poised for a digital-first resurrection. The strategic bifurcation of the business—carving out the profitable digital and wholesale pieces while shedding the liabilities of the physical stores—is the new blueprint for legacy brand survival. By returning to its technical roots through the relaunch of First Ascent and leveraging AI-driven efficiencies, the brand owners hope to recapture the technical credibility that was lost during decades of casual-focused expansion. For the broader retail industry, the Eddie Bauer case serves as a cautionary tale: in the economy of the mid-2020s, a storied history and a well-known name are no longer enough to support the high fixed costs of a traditional retail fleet. The future of legacy retail is asset-light, digital-first, and increasingly separated from the physical malls that once defined it.
The U.S. labor market began 2026 with a surprising burst of energy, shaking off a sluggish 2025. According to the latest data from the Bureau of Labor Statistics (BLS) released on February 11, 2026, employers added 130,000 jobs in January—easily doubling December’s figures and blowing past economist expectations of roughly 70,000.
While the report was delayed by a week due to a brief federal government shutdown, the results suggest that the “hiring fatigue” seen late last year might be beginning to thaw.
The Numbers at a Glance
The January report offers a mix of resilience and necessary context for the year ahead:
Total Jobs Added: 130,000 (up from a revised 50,000 in December).
Unemployment Rate: Ticked down to 4.3% (from 4.4%).
Average Hourly Earnings: Rose by 0.4% in January, bringing the year-over-year increase to 3.7%.
Labor Force Participation: Remained steady at 62.5%.
Sector Winners and Losers
The growth wasn’t uniform across the board. In fact, a few key sectors carried the heavy lifting for the entire economy:
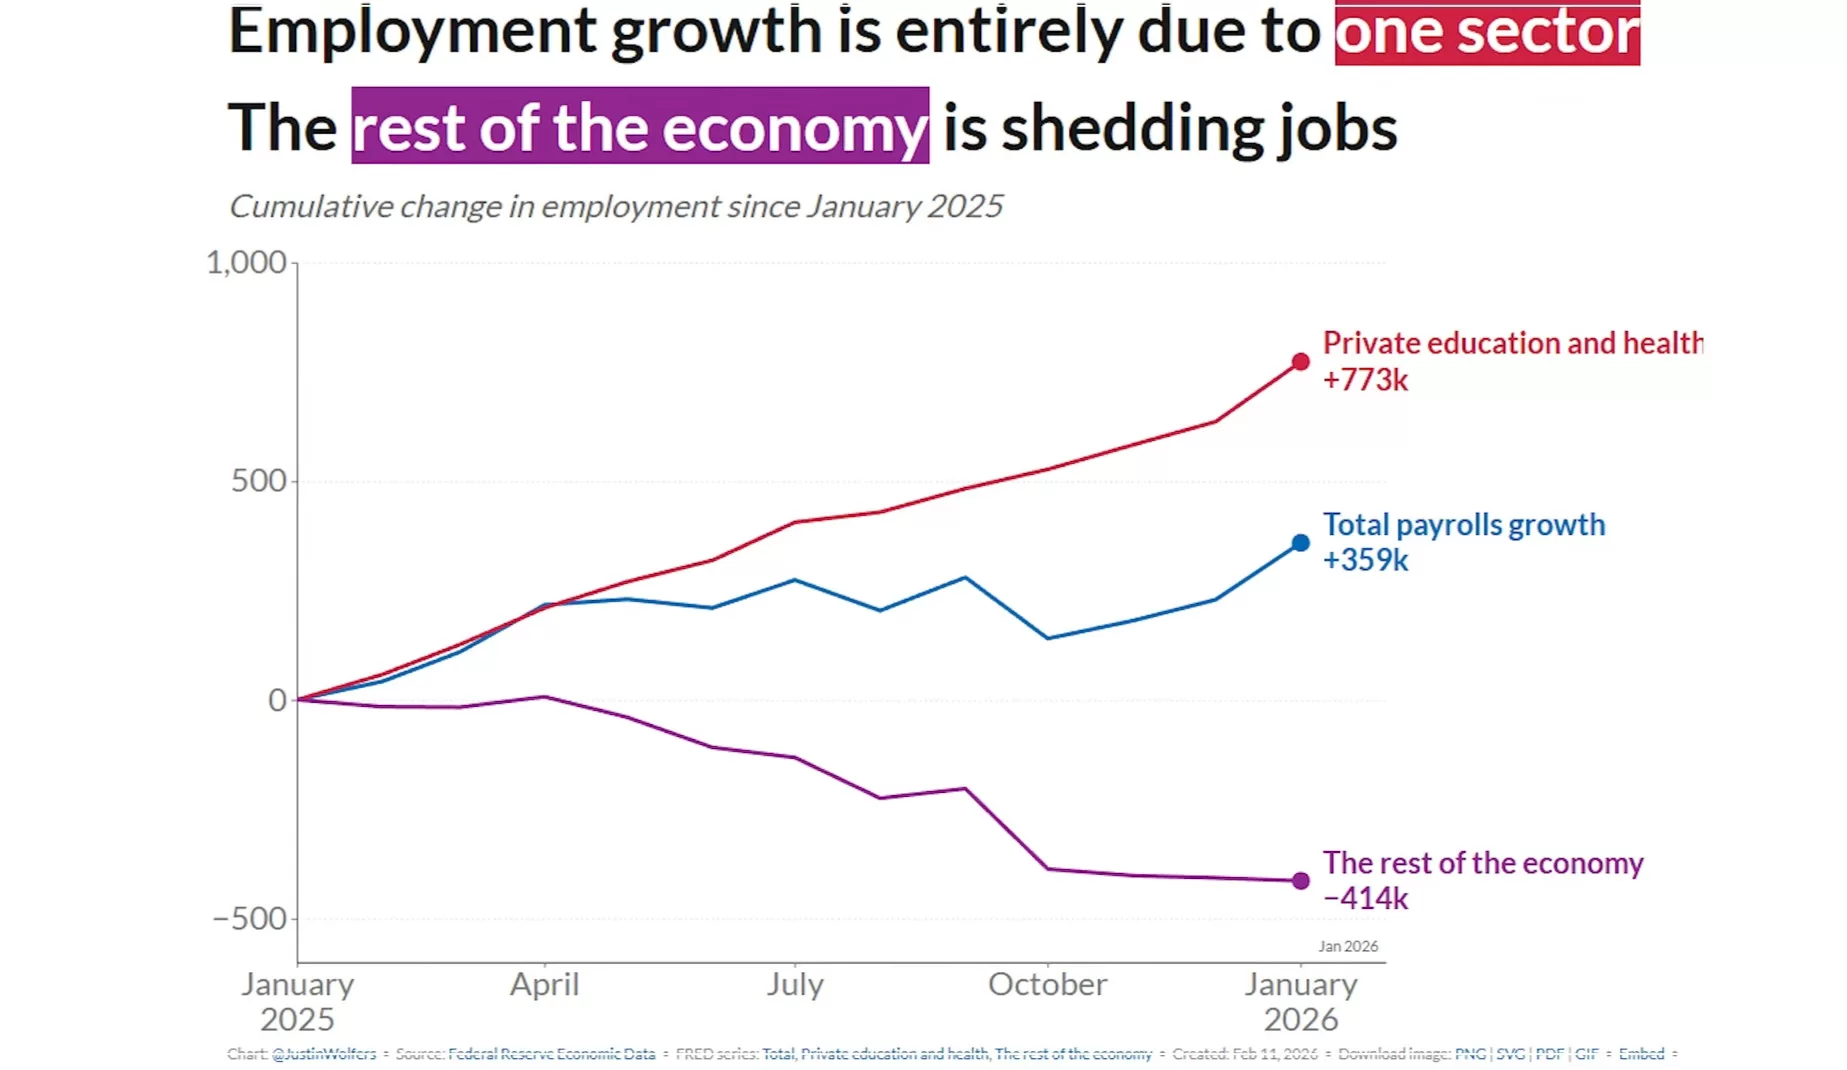
Healthcare & Social Assistance: This sector remains the titan of the U.S. job market, adding 124,000 jobs (82k in healthcare and 42k in social assistance).
Construction: Added a solid 33,000 jobs, largely driven by nonresidential specialty trade contractors.
The Tech & White-Collar Slump: Conversely, professional and business services and manufacturing continued to struggle, reflecting ongoing shifts in AI implementation and trade policy impacts.
Government: Federal employment saw a decline, partly a ripple effect of recent policy shifts and the temporary shutdown.
Why This Matters
After a tumultuous 2025—which was recently revised to show only 181,000 total jobs added for the entire year—this January figure is a massive sigh of relief. It suggests that while the economy isn’t sprinting, it’s found its footing.
“The January gains are a sign that the labor market is stabilizing,” says one economist. “However, the high concentration of growth in healthcare suggests a ‘one-legged stool’ economy that we need to watch closely.”
Looking Ahead
While 130,000 jobs is a “stronger footing,” the market remains complex. Layoffs in high-profile sectors like tech and transportation (notably Amazon and UPS) dominated January headlines, yet the aggregate data shows that other sectors are more than absorbing that displaced talent.
For job seekers, the message is clear: the opportunities are there, but they have shifted. Strategic hiring is the theme of 2026, with a high premium on specialized skills in healthcare, infrastructure, and adaptive technologies.
The January jobs report has effectively shifted the narrative for the Federal Reserve. While the 130,000 jobs added might seem modest by historical standards, it was a significant “beat” compared to expectations, and it has given the Fed a reason to tap the brakes on further interest rate cuts.
Here is how the latest data is influencing the Fed’s next move:
1. From “Easing” to “Holding”
Following three consecutive rate cuts in late 2025, the Federal Reserve held rates steady at its January 28, 2026 meeting, maintaining the federal funds rate at 3.5% to 3.75%. This jobs report reinforces that “pause.”
The Consensus: With the unemployment rate ticking down to 4.3% and job growth doubling December’s numbers, there is no longer an “emergency” need to stimulate the economy.
Market Sentiment: Before this report, some traders were betting on a March cut. Now, CME FedWatch tools show those odds have plummeted, with the consensus moving toward a “higher for longer” stance through at least the first half of the year.
2. Emerging Internal Division
The Fed is no longer acting in total unison. The January meeting saw a rare 10-2 vote, with two dissenting members actually pushing for another 25-basis-point cut due to lingering concerns about long-term hiring weakness.
The Hawks: Officials like Cleveland Fed President Beth Hammack and Dallas Fed President Lorie Logan have signaled that the Fed should “err on the side of patience,” arguing that current rates are “neutral”—neither helping nor hurting the economy.
The Doves: Those worried about the “one-legged stool” (growth coming only from healthcare) fear that without more cuts, sectors like tech and manufacturing will continue to bleed jobs.
3. The “Neutral Rate” Debate
Chair Jerome Powell recently noted that the economy is on a “firm footing” entering 2026. Analysts now believe the Fed is searching for the neutral rate—the sweet spot where inflation stays at 2% without triggering a recession.
Because average hourly earnings rose 0.4% in January (3.7% annually), the Fed is wary that cutting rates too soon could reignite inflation, especially with potential new trade tariffs on the horizon.
Key Dates to Watch
Event
Date
Significance
January CPI Report
Feb 13, 2026
Will confirm if the wage growth in the jobs report is driving up prices.
Fed “Beige Book”
Mar 4, 2026
Regional reports on how small businesses are actually feeling.
Next FOMC Meeting
Mar 17-18, 2026
The next formal window for a rate change decision.
For a small business owner, the January jobs report isn’t just about hiring statistics—it’s a leading indicator for the cost of your next loan or line of credit.
Following the stronger-than-expected labor data, the Federal Reserve has hit “pause” on interest rate cuts. For businesses at Versant Funding and across the U.S., this means a period of “stabilized high” borrowing costs. Here is what your business needs to know to navigate the financial landscape of early 2026.
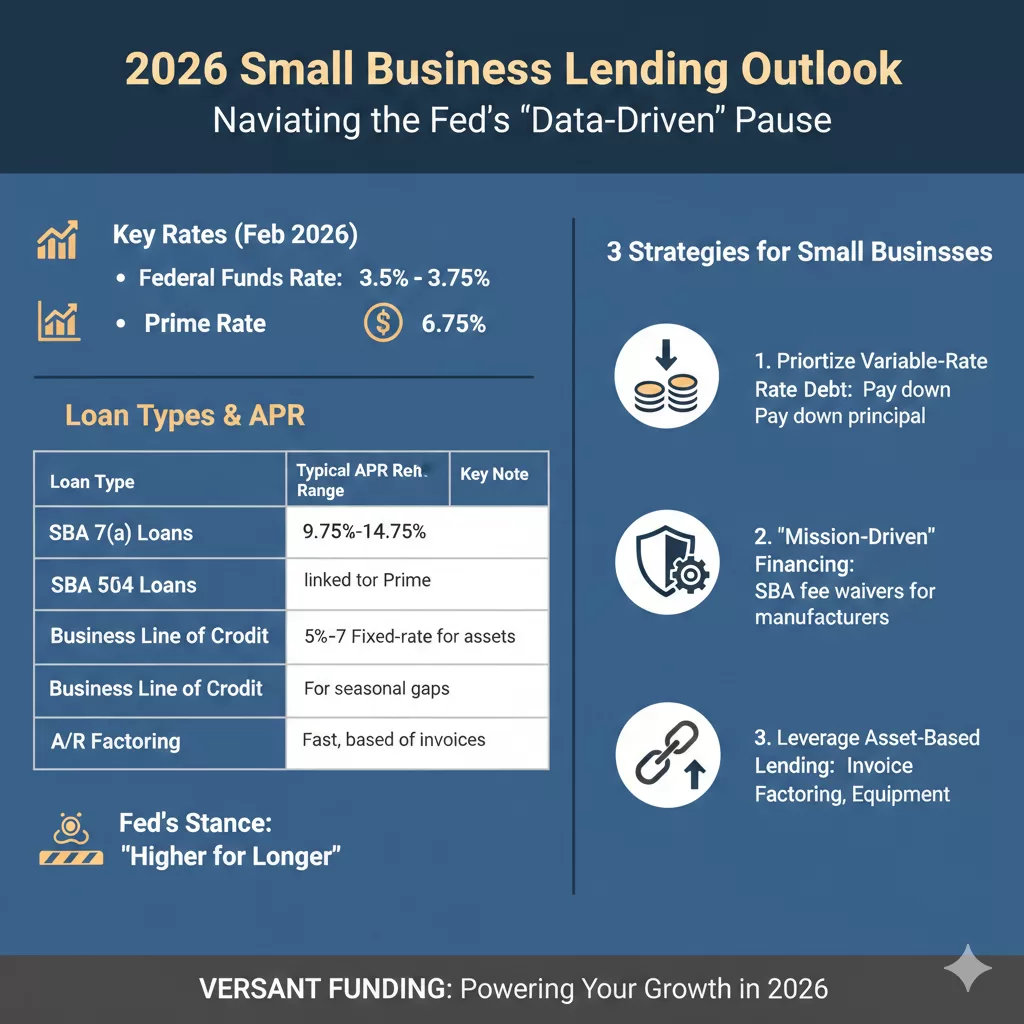
2026 Borrowing Outlook: The “Data-Driven” Pause
The Fed began 2026 by holding the federal funds rate steady at 3.5% to 3.75%. While the market had hoped for more aggressive easing, the surge of 130,000 new jobs in January has signaled to policymakers that the economy is not yet in need of more “cheap money.”
Current Lending Rates (As of February 2026)
Loan Type
Typical APR Range
Key Note
SBA 7(a) Loans
9.75% – 14.75%
Variable rates fluctuate with the Prime Rate (currently 6.75%).
SBA 504 Loans
5% – 7%
Fixed-rate; best for long-term real estate or equipment.
Business Lines of Credit
10% – 28%
Vital for seasonal inventory and payroll gaps.
Accounts Receivable Factoring
24% – 36%
High speed; based on invoice value rather than credit score.
Three Strategies for Small Businesses
With rates unlikely to drop significantly before the summer, owners should shift from “waiting for better rates” to “optimizing current cash flow.”
Prioritize Variable-Rate Debt: If you are carrying an SBA 7(a) loan or a variable line of credit, your payments will remain flat for now. Use this stability to pay down principal where possible, as the “higher for longer” stance means interest costs won’t be melting away anytime soon.
Look for “Mission-Driven” Financing: In 2026, the SBA is waiving guarantee fees for certain small manufacturers (NAICS 31-33). If your business fits this category, you could save thousands in upfront costs regardless of the interest rate.
Leverage Asset-Based Lending: If traditional bank term loans are too restrictive, consider Invoice Factoring or Equipment Financing. These options often focus more on the value of your assets (your unpaid invoices or machinery) than on the Fed’s baseline rates, providing more predictable access to capital during economic volatility.
The Bottom Line
The “stronger footing” of the U.S. labor market is a double-edged sword: it proves consumer demand is resilient, but it keeps the cost of capital elevated. For 2026, the most successful businesses will be those that prioritize liquidity and debt structure over simply chasing the lowest rate.
The results of recent surveys, most notably the Capital One Middle Market Strategic Investments report, have sent a ripple of confidence through the business community: 89% of middle-market companies are optimistic about their growth in 2026.
For those who track the “engine room” of the U.S. economy, this isn’t just a number—it’s a signal of a major strategic pivot. After years of playing defense against inflation and supply chain “whack-a-mole,” the middle market is moving back to offense.
Here is my take on why the “Mighty Middle” is feeling so bullish and what this means for the year ahead.
1. The “Big Beautiful Bill” Effect
A significant driver of this 89% figure is the One Big Beautiful Bill Act (OBBBA) passed in late 2025. Middle-market leaders aren’t just aware of the policy; they are already building it into their spreadsheets.
Tax Certainty: By codifying full expensing of capital expenditures and maintaining the 21% corporate tax rate, the bill has removed the “wait and see” hurdle that often stalls big investments.
Cash Flow: 59% of companies expect improved cash flow through these incentives, giving them the “dry powder” needed to expand.
2. AI: From “Hype” to “Help”
In 2024 and 2025, AI was a buzzword. In 2026, it’s a budget line item.
Operational Efficiency: 66% of middle-market businesses are prioritizing AI investment, not to replace humans, but to solve the persistent labor crunch.
ROI Focus: Unlike the “growth at all costs” tech era, middle-market firms are looking for AI to deliver specific returns—29% expect AI to be their highest-yielding investment this year.
3. Resilience Through “Alternate” Means
What I find most fascinating is the evolution of middle-market financing. With traditional bank lending remaining tight, 50% of these companies are now pursuing alternate financing, specifically private credit.
The Takeaway: Middle-market companies are no longer at the mercy of traditional interest rate cycles. They have diversified their “oxygen supply” (capital), allowing them to stay optimistic even when the Fed is being cautious.
4. The M&A “Spring”
After a multi-year slumber, deal-making is waking up. Nearly 44% of middle-market firms intend to pursue acquisitions in 2026. This suggests that the optimism isn’t just about internal growth; it’s about consolidation and picking up smaller players who may not have the scale to handle 2026’s regulatory and technological demands.
The Bottom Line: Execution is the New Strategy
The 89% optimism rate doesn’t mean the road is easy. Leaders are still citing inflation (97%) and tariffs as major headaches. However, the difference in 2026 is preparedness.
Middle-market companies have spent the last two years “stress-testing” their models. They are leaner, more tech-forward, and more agile than they were pre-2020. If 89% of them believe they can win this year, the rest of the market should probably pay attention.
The “Mighty Middle” is playing offense in 2026. 🚀
The numbers are in, and they are striking: 89% of middle-market companies are officially optimistic about their growth this year.
After years of navigating the “whack-a-mole” challenges of inflation and supply chain disruptions, we are seeing a massive strategic pivot. Middle-market leaders aren’t just surviving; they are scaling.
Why the surge in confidence?
The OBBBA Effect: Tax certainty and full expensing are providing the “dry powder” needed for major capital investments.
AI Integration: We’ve moved past the hype. Companies are now budgeting for AI to solve real-world labor shortages and drive operational efficiency.
Alternative Financing: With traditional bank lending remaining tight, the shift toward private credit and alternative capital sources is keeping growth on track.
M&A Resurgence: Nearly 44% of these firms are looking to acquire, signaling a year of consolidation and expansion.
The bottom line? These companies have “stress-tested” their models for two years. They are leaner, tech-forward, and ready to win.
Is the Middle Market the new economic bellwether for 2026? 📈
The data is hard to ignore: 89% of middle-market firms are entering 2026 with high optimism. This isn’t just “wishful thinking”—it’s a calculated response to a shifting fiscal and technological landscape.
Here are the four pillars driving this confidence:
Fiscal tailwinds: The One Big Beautiful Bill Act (OBBBA) has finally provided the tax certainty and full-expensing incentives required to move “wait-and-see” capital into active deployments.
Maturity in AI adoption: We have moved beyond the “hype cycle.” 66% of mid-cap leaders are now prioritizing AI as a tool for operational leverage, specifically targeting persistent labor bottlenecks.
The Rise of Alternative Credit: As traditional bank lending remains constrained, the pivot toward private credit and specialized liquidity solutions has decoupled middle-market growth from traditional interest rate volatility.
Strategic Consolidation: With 44% of firms pursuing M&A, we are entering a period of significant market “up-tiering.”
The “Mighty Middle” has spent the last 24 months stress-testing their balance sheets. In 2026, they aren’t just defending their position—they are expanding it.
Contains information related to marketing campaigns of the user. These are shared with Google AdWords / Google Ads when the Google Ads and Google Analytics accounts are linked together.
90 days
__utma
ID used to identify users and sessions
2 years after last activity
__utmt
Used to monitor number of Google Analytics server requests
10 minutes
__utmb
Used to distinguish new sessions and visits. This cookie is set when the GA.js javascript library is loaded and there is no existing __utmb cookie. The cookie is updated every time data is sent to the Google Analytics server.
30 minutes after last activity
__utmc
Used only with old Urchin versions of Google Analytics and not with GA.js. Was used to distinguish between new sessions and visits at the end of a session.
End of session (browser)
__utmz
Contains information about the traffic source or campaign that directed user to the website. The cookie is set when the GA.js javascript is loaded and updated when data is sent to the Google Anaytics server
6 months after last activity
__utmv
Contains custom information set by the web developer via the _setCustomVar method in Google Analytics. This cookie is updated every time new data is sent to the Google Analytics server.
2 years after last activity
__utmx
Used to determine whether a user is included in an A / B or Multivariate test.
18 months
_ga
ID used to identify users
2 years
_gali
Used by Google Analytics to determine which links on a page are being clicked
30 seconds
_ga_
ID used to identify users
2 years
_gid
ID used to identify users for 24 hours after last activity
24 hours
_gat
Used to monitor number of Google Analytics server requests when using Google Tag Manager