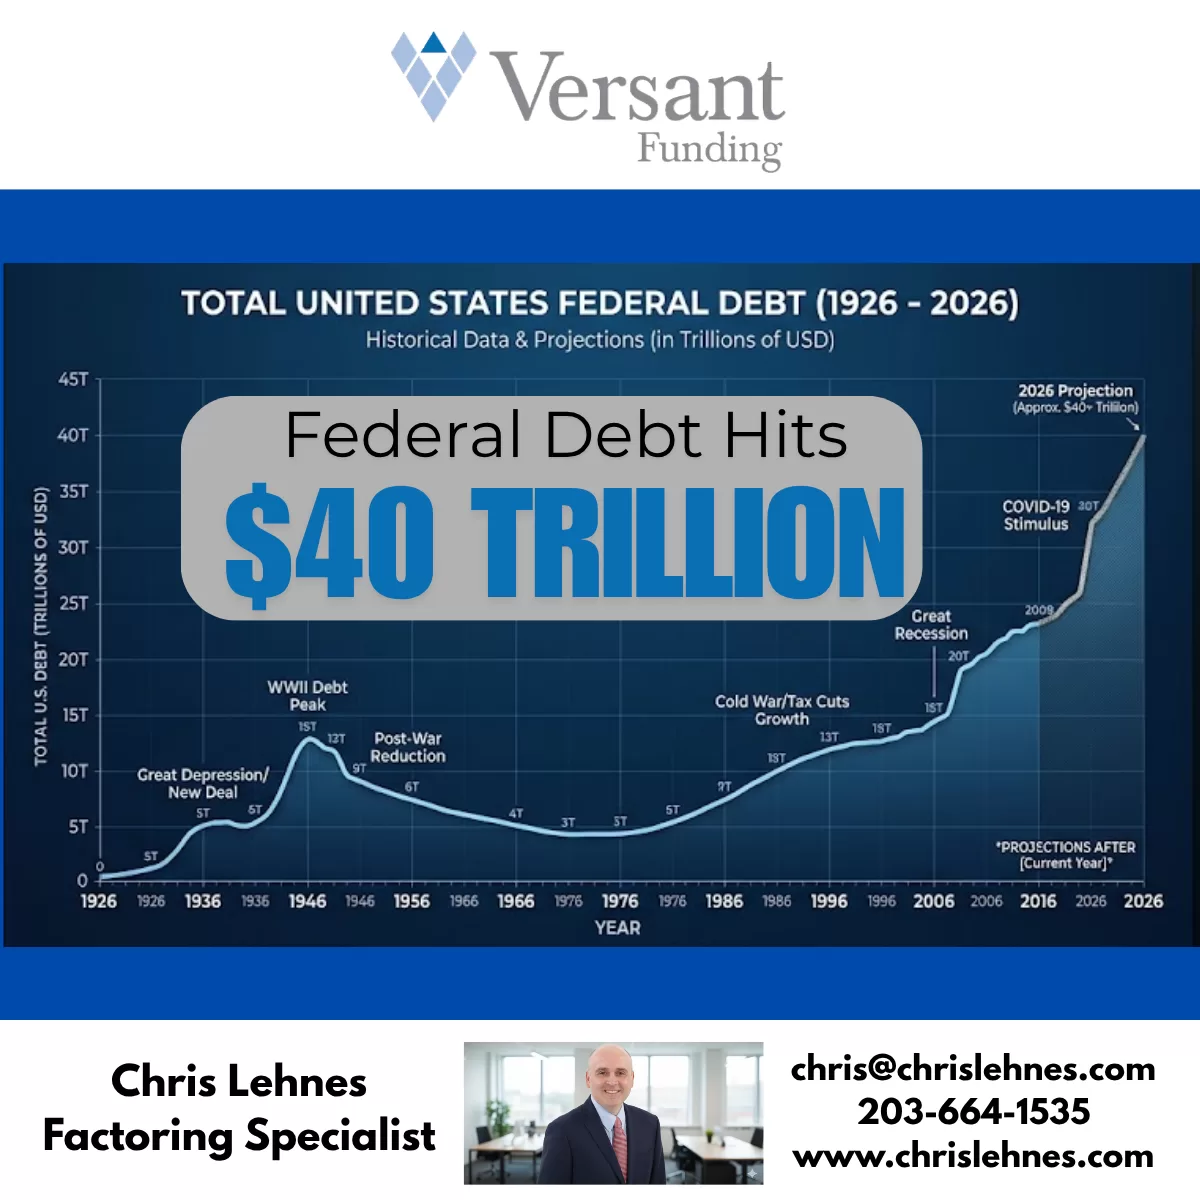
While that figures is symbolically significant, it is not economically significant. Most investors and economists focus on other metrics, like the Debt to GDP ration, a better sense of an country’s borrowing ability.
But, $40 trillion is a big number, and will draw attention to an unsustainable fiscal trajectory.
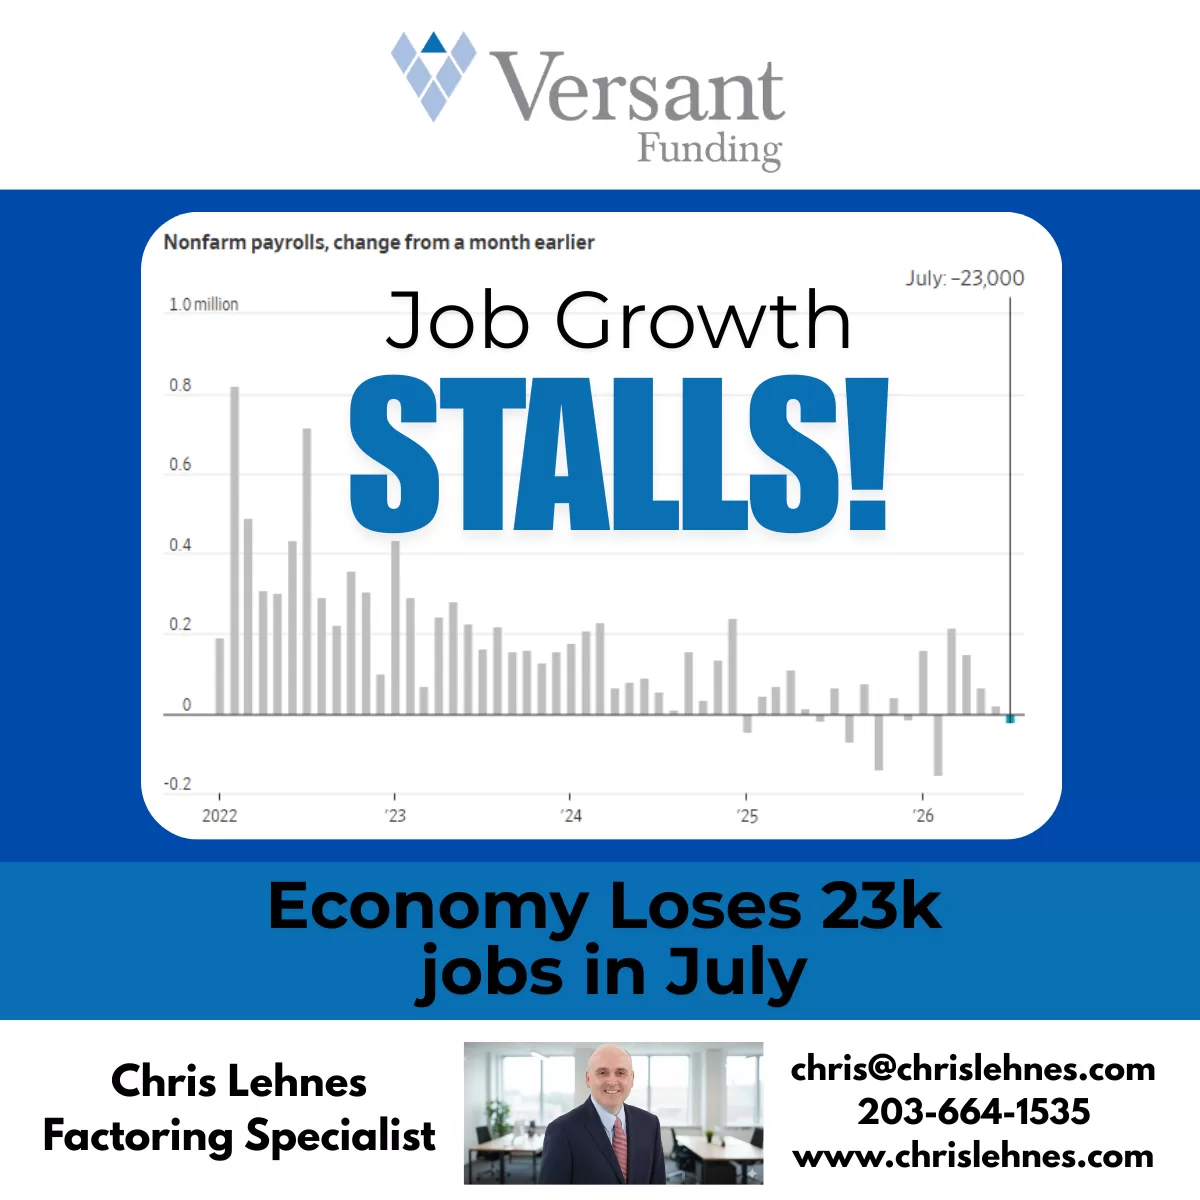
Job Growth: The U.S. labor market lost jobs in July, an surprising contraction likely to reignite questions about the economy’s strength when it is also facing elevated inflation.
The latest U.S. Department of Labor report showed that the economy lost 23k jobs in July, a large shortfall undercutting the gain of 83k that economists surveyed by The Wall Street Journal had expected.
Revisions to prior month results showed that the economy added 103k fewer jobs in May and June.
The unemployment rate reduced to 4.1%, from 4.2% in June, even though fewer people were working due to even more individuals existing the workforce.
In yet another troubling sign for the labor market, the Bureau of Labor Statistics said that it revised down the prior two months by a combined 103,000. May’s jobs total was cut by 66,000 to 129,000 total jobs added, while June’s total was lowered by 37,000 to a total gain of 57,000.
Economists had been expecting wages to continue pacing at 3.5% from a year ago, but instead wage growth slowed.
“The labor market is stalling again,” wrote Heather Long, chief economist at Navy Federal Credit Union, who called the report “bleak.”
The BLS said employment contracted the most in “local government education,” which declined by 50,000 roles, likely reflecting teachers during summer break. It also flagged a contraction of 19,000 roles in the retail industry. The financial industry shed 14,000 roles.
The agency’s data also showed a 5,000 payroll gain in the manufacturing sector in July and an additional 22,000 roles in construction. These bright spots come as the AI data center boom has benefited some industries, but deeply divided many communities where the centers are located.
Friday’s report likely eases some pressure on the Federal Reserve, which had been widely expected to hike the federal funds rate — potentially as soon as September.
Impact of Iran War Ripple through the Economy Due to Gas Prices
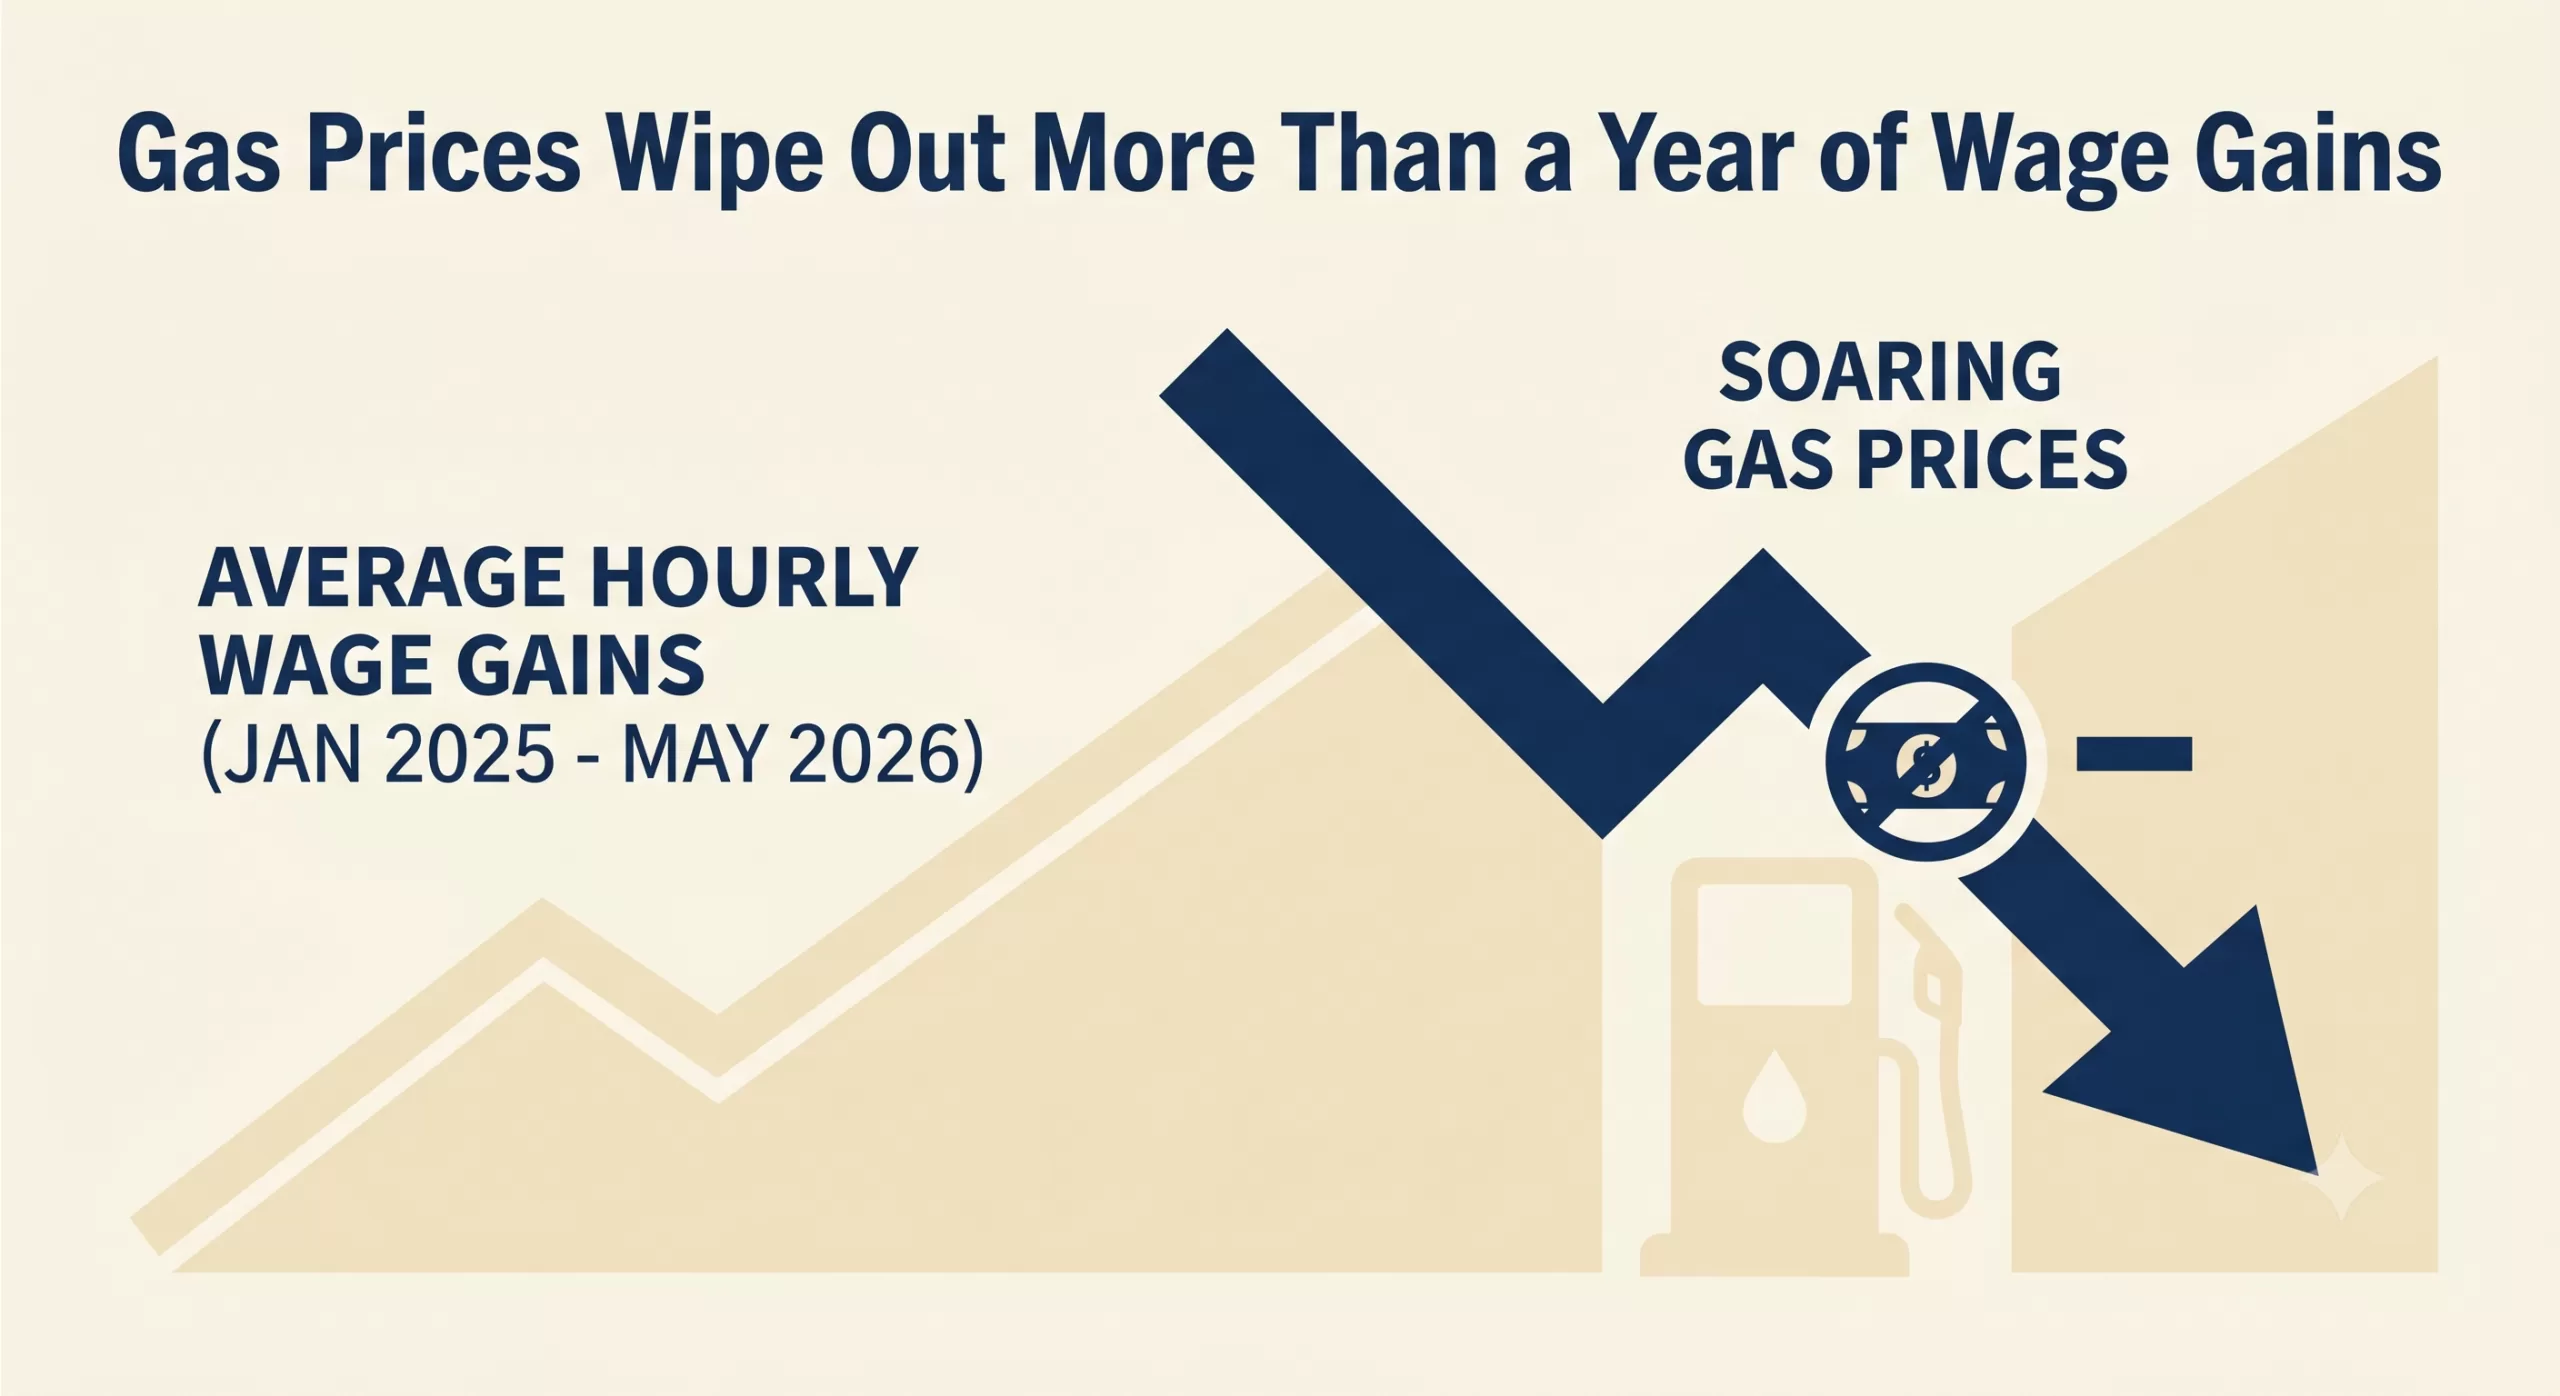
The latest macroeconomic indicators including gas prices paint a challenging picture for both consumers and businesses. Following the Labor Department‘s recent reports, it is clear that soaring energy costs have effectively neutralized recent progress in worker compensation. With top-line inflation advancing to 4.2% in May—the highest level in three years—and gasoline prices surging, real average hourly earnings have been pushed all the way back to January 2025 levels.
For the second consecutive month, inflation has outpaced wage growth. The reality is that gas prices have wiped out more than a year of wage gains.
The Macroeconomic Squeeze
The ripple effects of this inflationary spike are significant. The Federal Reserve now faces a complex policy dilemma as they weigh interest rate decisions against a backdrop of stubborn inflation and squeezed household budgets. When wages lag behind inflation, consumer spending inevitably cools, particularly among middle- and lower-income brackets who are forced to allocate a larger share of their take-home pay to essentials like fuel and groceries.
What This Means for Business Owners
While the headlines focus on the consumer at the pump, small and mid-sized businesses are absorbing these shocks on multiple fronts:
Increased Operational Costs: Surging fuel prices directly inflate the cost of transportation, logistics, and supply chain operations.
Margin Compression: Businesses face the difficult choice of passing higher costs onto increasingly price-sensitive consumers or absorbing the losses and shrinking their profit margins.
Wage Pressure: Even though real wages are falling, nominal wage demands remain high as employees seek relief from the rising cost of living, straining payroll budgets.
Navigating the Cash Flow Crunch
During periods of high inflation and uncertain interest rates, liquidity becomes a paramount concern. Industries heavily reliant on steady cash flow—such as manufacturing, staffing, healthcare, and distribution—can find their working capital severely constrained when expenses rise faster than revenues can be collected.
Waiting 30, 60, or 90 days for clients to pay outstanding invoices is a luxury many companies cannot afford when the cost of doing business is escalating weekly. Accounts receivable factoring offers a strategic mechanism to bridge this gap. By converting outstanding B2B invoices into immediate working capital, business owners can cover rising operational costs, meet payroll obligations, and navigate economic volatility without taking on new debt or waiting on unpredictable macroeconomic shifts.
As we continue to monitor the inflation data and the Fed’s next moves, maintaining robust working capital will be the defining factor for businesses looking to weather this storm.
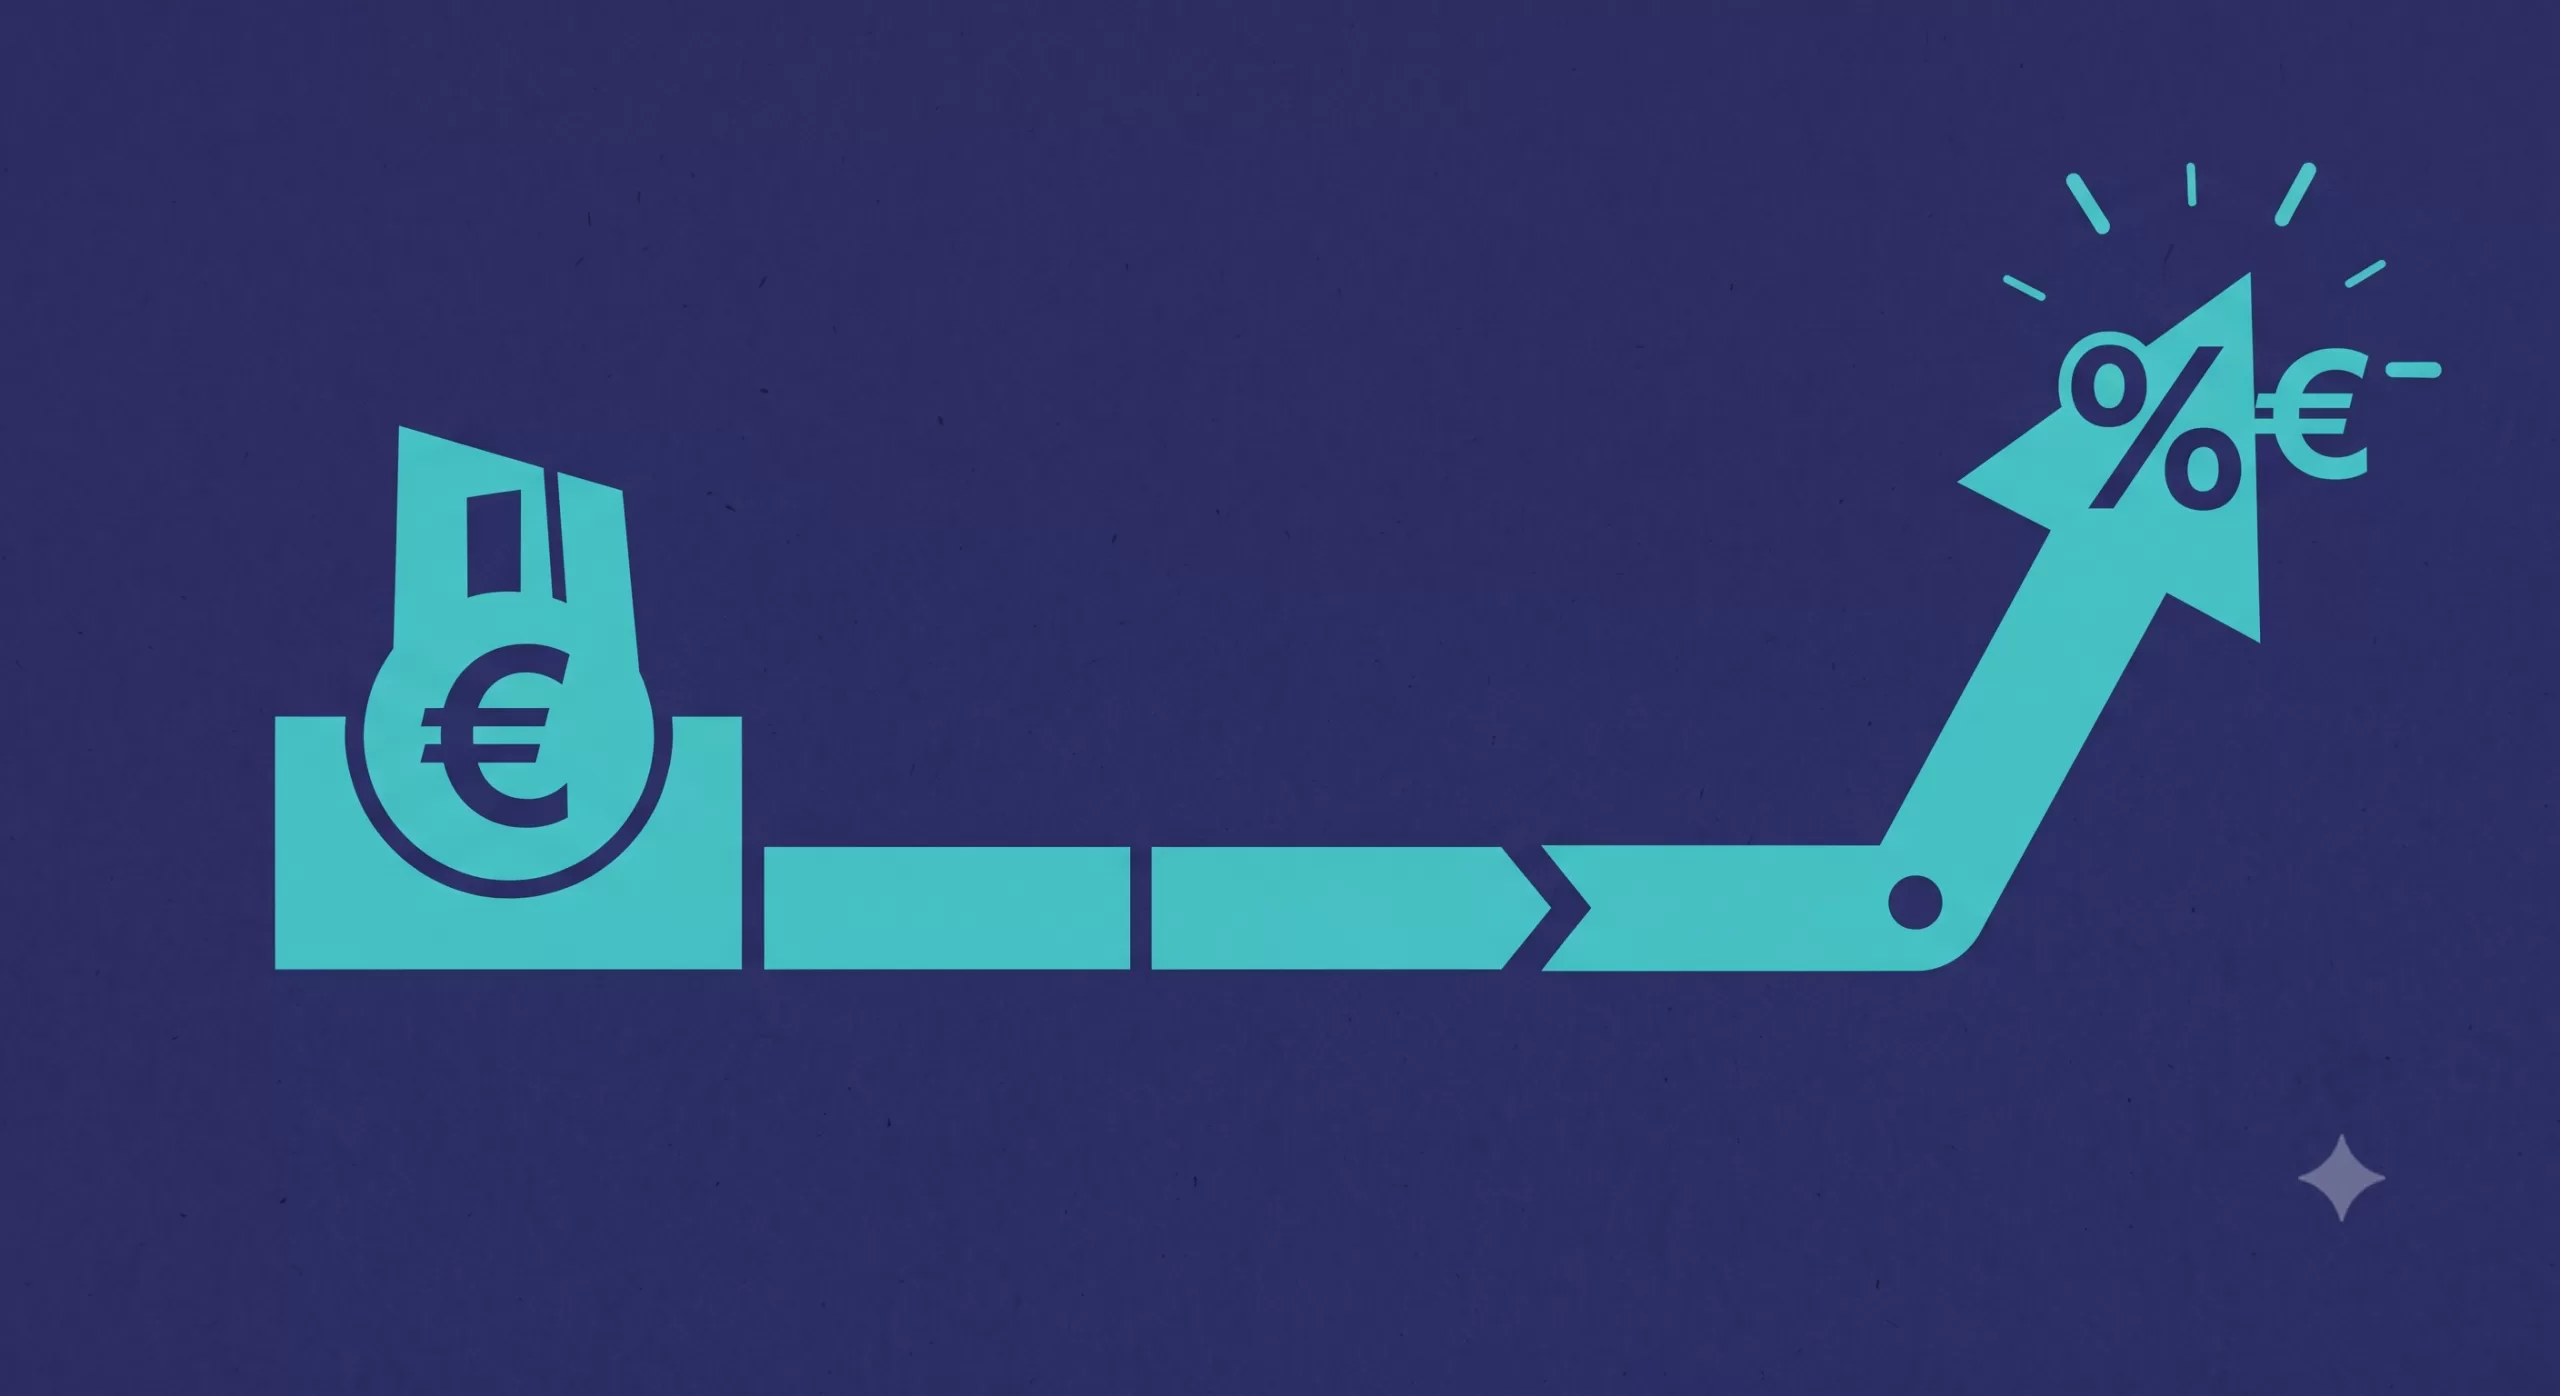
Today marks a significant turning point in European monetary policy: the European Central Bank (ECB) has officially reversed course, raising its key interest rates for the first time in nearly three years.
After an extended period of cuts and holds, the era of steadily declining borrowing costs in the Eurozone has temporarily hit a wall. Let’s break down the data, the underlying causes, and what this means for the broader economy.
The Decision: By the Numbers
In a move widely anticipated by financial markets and economists, the ECB’s Governing Council elected to raise its key interest rates by 0.25 percentage points (25 basis points).
Here is a quick breakdown of where the central bank’s key rates stand effective immediately:
ECB Facility
Previous Rate
New Rate (June 2026)
Deposit Facility
2.00%
2.25%
Main Refinancing Operations
2.15%
2.40%
Marginal Lending Facility
2.40%
2.65%
This decision officially ends a cycle that began back in September 2023, representing a decisive reaction to shifting economic realities on the ground.
Why is the ECB Hiking Rates Now?
The ECB has a single, primary mandate: to maintain price stability by targeting an inflation rate of 2.0%. The decision to hike rates is a direct response to recent data showing that inflation is moving in the wrong direction.
Headline Inflation Surge: In May 2026, Eurozone consumer prices rose to 3.2% year-over-year. This marks a significant acceleration from earlier in the year and blows past the central bank’s comfort zone.
The Energy Shock: A major driver behind this inflationary spike is the ongoing geopolitical conflict in the Middle East. Disrupted shipping routes and volatile commodity markets caused energy prices to jump nearly 11% last month compared to the same period last year.
Core Inflation Creep: The energy shock isn’t isolated. Core inflation—which strips out highly volatile food and energy costs—rose to 2.5%. This indicates that higher energy overheads are beginning to bleed into the broader costs of everyday goods and services.
What Does This Mean for the Eurozone?
When the ECB pulls the interest rate lever, the effects ripple through the entire financial system. Here is what to expect:
More Expensive Borrowing: For consumers and businesses, the cost of credit is going up. Homeowners holding variable-rate or tracker mortgages will see their monthly repayments increase almost immediately.
A Squeeze on Growth: While higher interest rates are necessary to cool down inflation, they simultaneously suppress economic activity. Reflecting the strain of higher energy costs and tighter financial conditions, the ECB has already revised its growth forecasts downward, anticipating the Eurozone economy will grow by a sluggish 0.8% in 2026.
Currency Impacts: Higher interest rates generally make a currency more attractive to yield-seeking investors. A hawkish stance from the ECB typically provides upward support for the Euro (EUR) against other major currencies, provided the broader economic outlook doesn’t deteriorate too sharply.
Looking Ahead: Is This the Start of a New Cycle?
The prevailing question for markets is whether this is a isolated adjustment or the beginning of a new tightening cycle.
Current market consensus suggests this won’t be a one-off event. Many analysts are pricing in at least one or two more quarter-point increases before the end of the year, which could bring the deposit rate up to 2.50% or 2.75%. However, ECB leadership has emphasized that future decisions will remain strictly “data-dependent.” The Governing Council will evaluate the ongoing impact of energy prices, geopolitical stability, and wage growth on a meeting-by-meeting basis.
The takeaway is clear: the ECB’s latest pivot highlights how rapidly external shocks can upend economic stability, forcing central banks to prioritize fighting inflation over stimulating growth.
If you’ve been keeping an eye on the economic headlines lately, you might have braced yourself for a sluggish jobs report this May. With rising inflation and the economic ripple effects of the ongoing conflict in Iran, many analysts were predicting a significant cooldown in hiring.
But the U.S. labor market just threw a massive curveball.
Here is a breakdown of the May 2026 jobs report, what the numbers actually mean, and why the American economy continues to show surprising resilience.
The Headline Numbers: Blowing Past Estimates
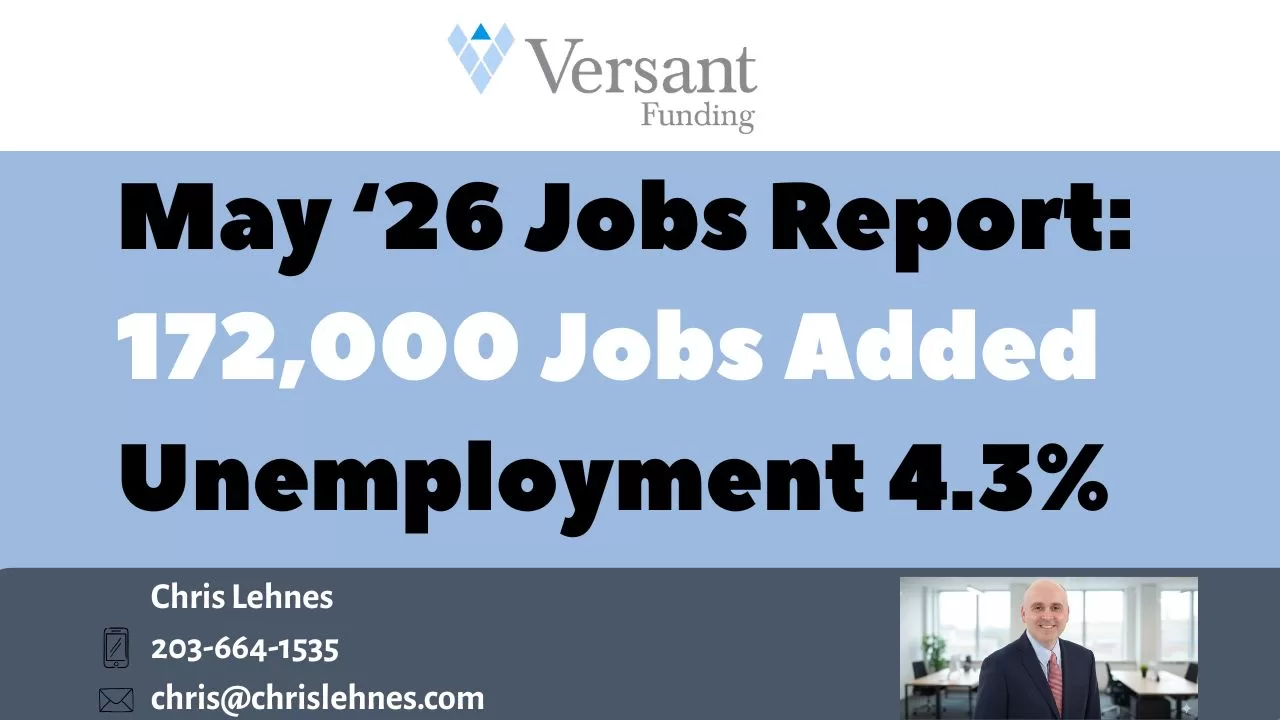
Economists were largely projecting a modest gain of around 85,000 jobs for May. Instead, the Labor Department revealed that U.S. employers added a robust 172,000 new jobs.
Total Jobs Added: 172,000 (vs. 85,000 expected)
Unemployment Rate: Held steady at 4.3%
Wage Growth: Average hourly earnings ticked up by 0.3% month-over-month.
April Revisions: April’s numbers were also sharply revised upward from 115,000 to an impressive 179,000.
This wasn’t just a slight beat; it was a doubling of expectations, indicating that businesses are still finding reasons to hire and expand, even in an uncertain macroeconomic climate.
Where Are the Jobs Coming From?
While the headline number is strong, the growth wasn’t entirely uniform across the board. The heavy lifting was done by a few key sectors:
Healthcare and Social Services: Continuing a long-running trend, healthcare remains a massive engine for job creation, accounting for a significant chunk of the new roles.
Leisure and Hospitality: As the weather warms up, consumer demand for travel and dining out remains steady, prompting strong hiring in this sector.
Local Government: Public sector hiring also saw notable gains.
Conversely, some sectors felt the pinch. Employment in financial activities slipped slightly, reflecting tighter borrowing conditions and shifting corporate strategies.
Resilience Amid Global Headwinds
The most fascinating takeaway from this report isn’t just the sheer number of jobs added—it’s the context in which they were created.
Since the escalation of the war in Iran earlier this year, global energy markets have been incredibly volatile. Spiking oil prices have renewed fears of inflation, putting pressure on consumer wallets and business operational costs alike. Despite these immense headwinds, the domestic labor market has absorbed the shock remarkably well.
The fact that employers are still confident enough to add 172,000 workers to their payrolls suggests an underlying structural strength in the U.S. economy that is, for now, overriding geopolitical anxieties.
What This Means for the Federal Reserve
Of course, a hot jobs report complicates things for the Federal Reserve.
When the labor market is strong and wage growth is steady, inflation tends to remain sticky. Prior to this report, there was speculation that the Fed might keep interest rates flat for the rest of the year. However, this display of economic resilience might push policymakers in a more hawkish direction. While the steady 4.3% unemployment rate means the labor market isn’t overheating, markets are now bracing for the possibility that the Fed could lift rates at least once by the end of 2026 to keep inflationary pressures in check.
The Bottom Line
The May 2026 jobs report is a potent reminder that the U.S. economy rarely behaves exactly as modeled. While the challenges of inflation and global conflict are very real, the underlying demand for labor remains undeniably robust. Whether this momentum can be sustained into the summer remains to be seen, but for now, the job market continues to defy the odds.
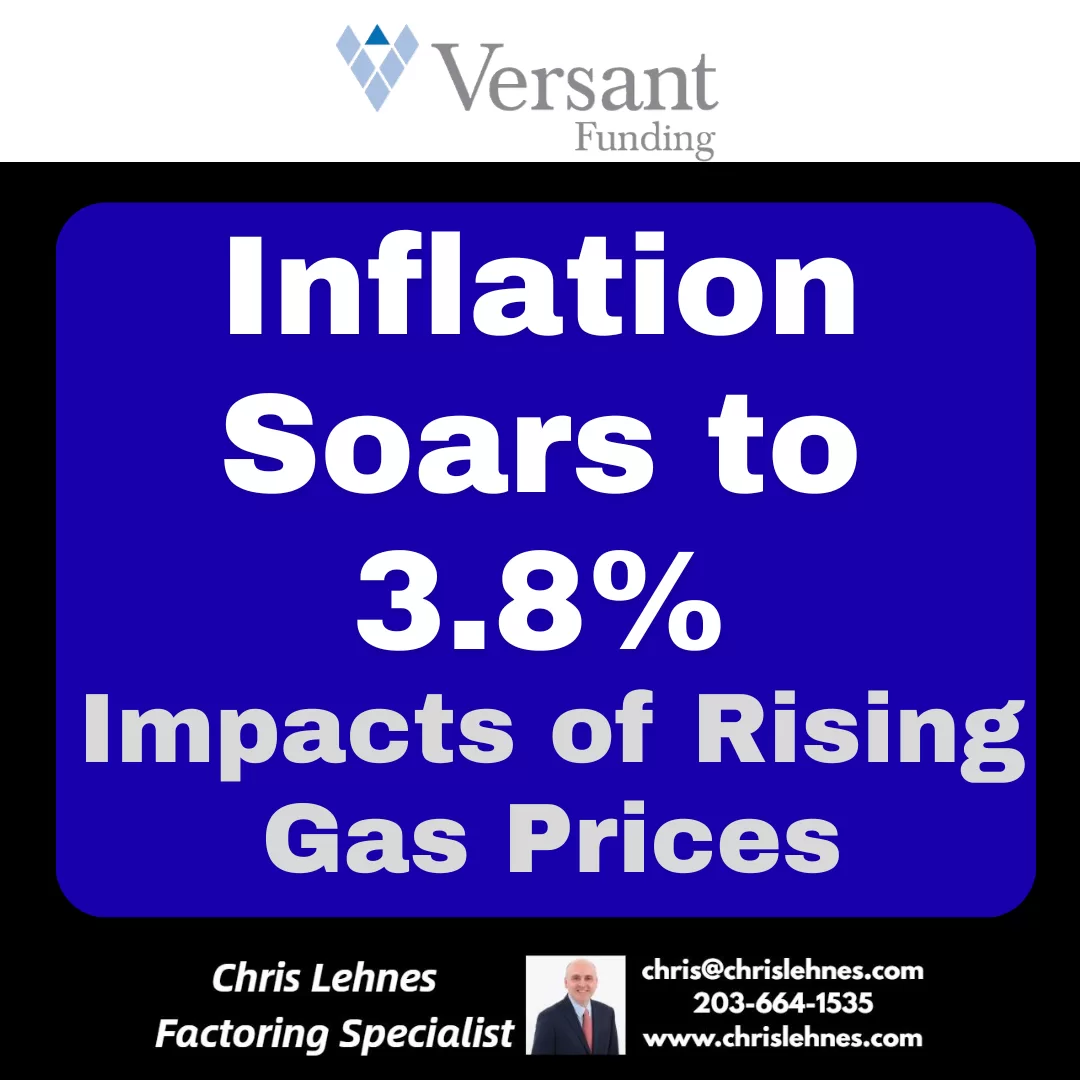
If your last trip to the gas station felt like a hit to your wallet, you aren’t alone. The latest Consumer Price Index (CPI) report is out, and the numbers confirm what we’ve all been feeling: U.S. inflation jumped to 3.8% in April, up from 3.3% in March.
This represents the highest inflation rate since 2023, and it marks a significant detour from the “path to 2%” that the Federal Reserve has been aiming for. While price increases have cooled in some sectors, the energy market is currently the primary engine driving these numbers higher.
Gasoline: The Primary Culprit
The standout figure in April’s report is the cost of energy. National average gas prices have surged to approximately $4.50 per gallon, a staggering jump from the sub-$3.00 levels seen just a few months ago in February.
This spike isn’t just a random market fluctuation. It is being driven heavily by geopolitical instability, specifically the ongoing conflict with Iran. The closure of the Strait of Hormuz—a vital artery for global oil supply—has sent shockwaves through the market. When a fifth of the world’s oil supply is threatened, the impact is immediate and felt directly at the local pump.
The “Trickle-Down” of High Energy Costs
High gas prices do more than just make commuting more expensive. They create a “cost-of-living” domino effect:
Transportation & Logistics: Shipping companies and airlines are facing massive fuel surcharges, which eventually get passed down to the consumer.
Food Prices: Agriculture and grocery distribution are energy-intensive. As diesel and gas prices rise, expect your grocery bill to remain stubbornly high.
Manufacturing: Factories that rely on heavy energy consumption are seeing their margins squeezed, leading to higher prices for finished goods.
What This Means for Interest Rates
For months, the big question in the financial world has been: When will the Fed cut interest rates?
This 3.8% reading makes that answer much more complicated. Outgoing Fed Chair Jerome Powell and incoming Chair Kevin Warsh are facing a “higher-for-longer” reality. Typically, the Fed raises interest rates to cool a hot economy and lower inflation. With inflation trending upward again, the prospect of rate cuts in 2026 is fading, and some economists are even whispering about the possibility of another hike if the energy crisis doesn’t stabilize.
The Bottom Line
The April inflation report is a sobering reminder of how interconnected our local economy is with global events. While the U.S. economy remains resilient in many areas, the “gasoline tax” created by geopolitical tension is a heavy burden for the average household.
For now, the focus remains on the Middle East. Until energy supply stabilizes, the Fed—and our bank accounts—will likely be in a defensive crouch.
What are you doing to offset rising costs? Are you changing your summer travel plans or looking into more fuel-efficient alternatives? Let us know in the comments below.
Mortgage Rates – The housing market has seen a welcome shift! Mortgage rates have fallen below 6% for the first time since 2022, offering a significant improvement for potential homebuyers. This news comes as a breath of fresh air after a period of steadily climbing rates that have put a strain on many budgets.
What Does This Mean for Potential Homebuyers?
The drop in mortgage rates translates directly into increased affordability for those looking to purchase a home. This can be beneficial in several ways:
Lower Monthly Payments: A lower interest rate means a smaller portion of your monthly payment goes towards interest, reducing your overall housing cost.
Increased Buying Power: With lower monthly payments, you may be able to qualify for a larger loan amount, potentially allowing you to purchase a more expensive home.
Refinancing Opportunities: Existing homeowners who currently have a higher mortgage rate may be able to refinance their loan and save money on their monthly payments.
Why Are Mortgage Rates Falling?
While the exact reasons behind the rate drop are complex, several factors may be contributing to the trend:
Lower Inflation: Inflation has shown signs of cooling down, which can influence interest rates.
Economic Growth: While economic growth has been moderate, some signs suggest it may be slowing, which can also affect mortgage rates.
Changes in the Bond Market: Bond yields, which are closely tied to mortgage rates, have also seen a decline.
What Should You Do Now?
If you’ve been on the fence about buying a home, this could be an excellent time to re-evaluate your options. Here are some steps to consider:
Get Pre-Approved for a Mortgage: This will give you a clear idea of how much you can borrow and help you understand your monthly payment.
Shop Around for Rates: Different lenders offer varying rates, so it’s essential to compare offers from multiple institutions.
Consider Your Long-Term Goals: While the lower rates are attractive, it’s crucial to ensure that buying a home is the right decision for your long-term financial goals.
Important Note: It’s important to remember that mortgage rates are subject to change based on economic conditions and other factors. While the current trend is encouraging, it’s essential to stay informed about any potential shifts in the market.
Conclusion:
The drop in mortgage rates below 6% is a significant development for the housing market, offering some much-needed relief to potential homebuyers and homeowners alike. If you’ve been considering buying a home, this could be the right time to take action. With lower monthly payments and increased buying power, you may be closer to achieving your homeownership goals than you thought. However, it’s crucial to act carefully and seek professional advice to make the best decision for your individual situation.
Primary Data Sources
Freddie Mac (Primary Mortgage Market Survey): The ultimate source for the 5.98% figure. Freddie Mac released its weekly report on February 26, 2026, confirming that the 30-year fixed-rate mortgage dipped below 6% for the first time in approximately 3.5 years.
The Federal Reserve (FRED): Used to verify historical trends, specifically confirming that the last time rates were at this level was September 8, 2022 (when they were 5.89%).
CBS News: Provided context on the White House’s initiatives (such as the $200 billion mortgage bond purchase plan) and expert commentary on the “spring home-buying season.”
Associated Press (AP): Detailed the influence of the 10-year Treasury yield on mortgage pricing and quoted housing economists regarding market entry for buyers and sellers.
Mortgage rates in 2026 forecast This video provides expert analysis on how these sub-6% rates impact monthly affordability and what to expect for the rest of the 2026 housing market
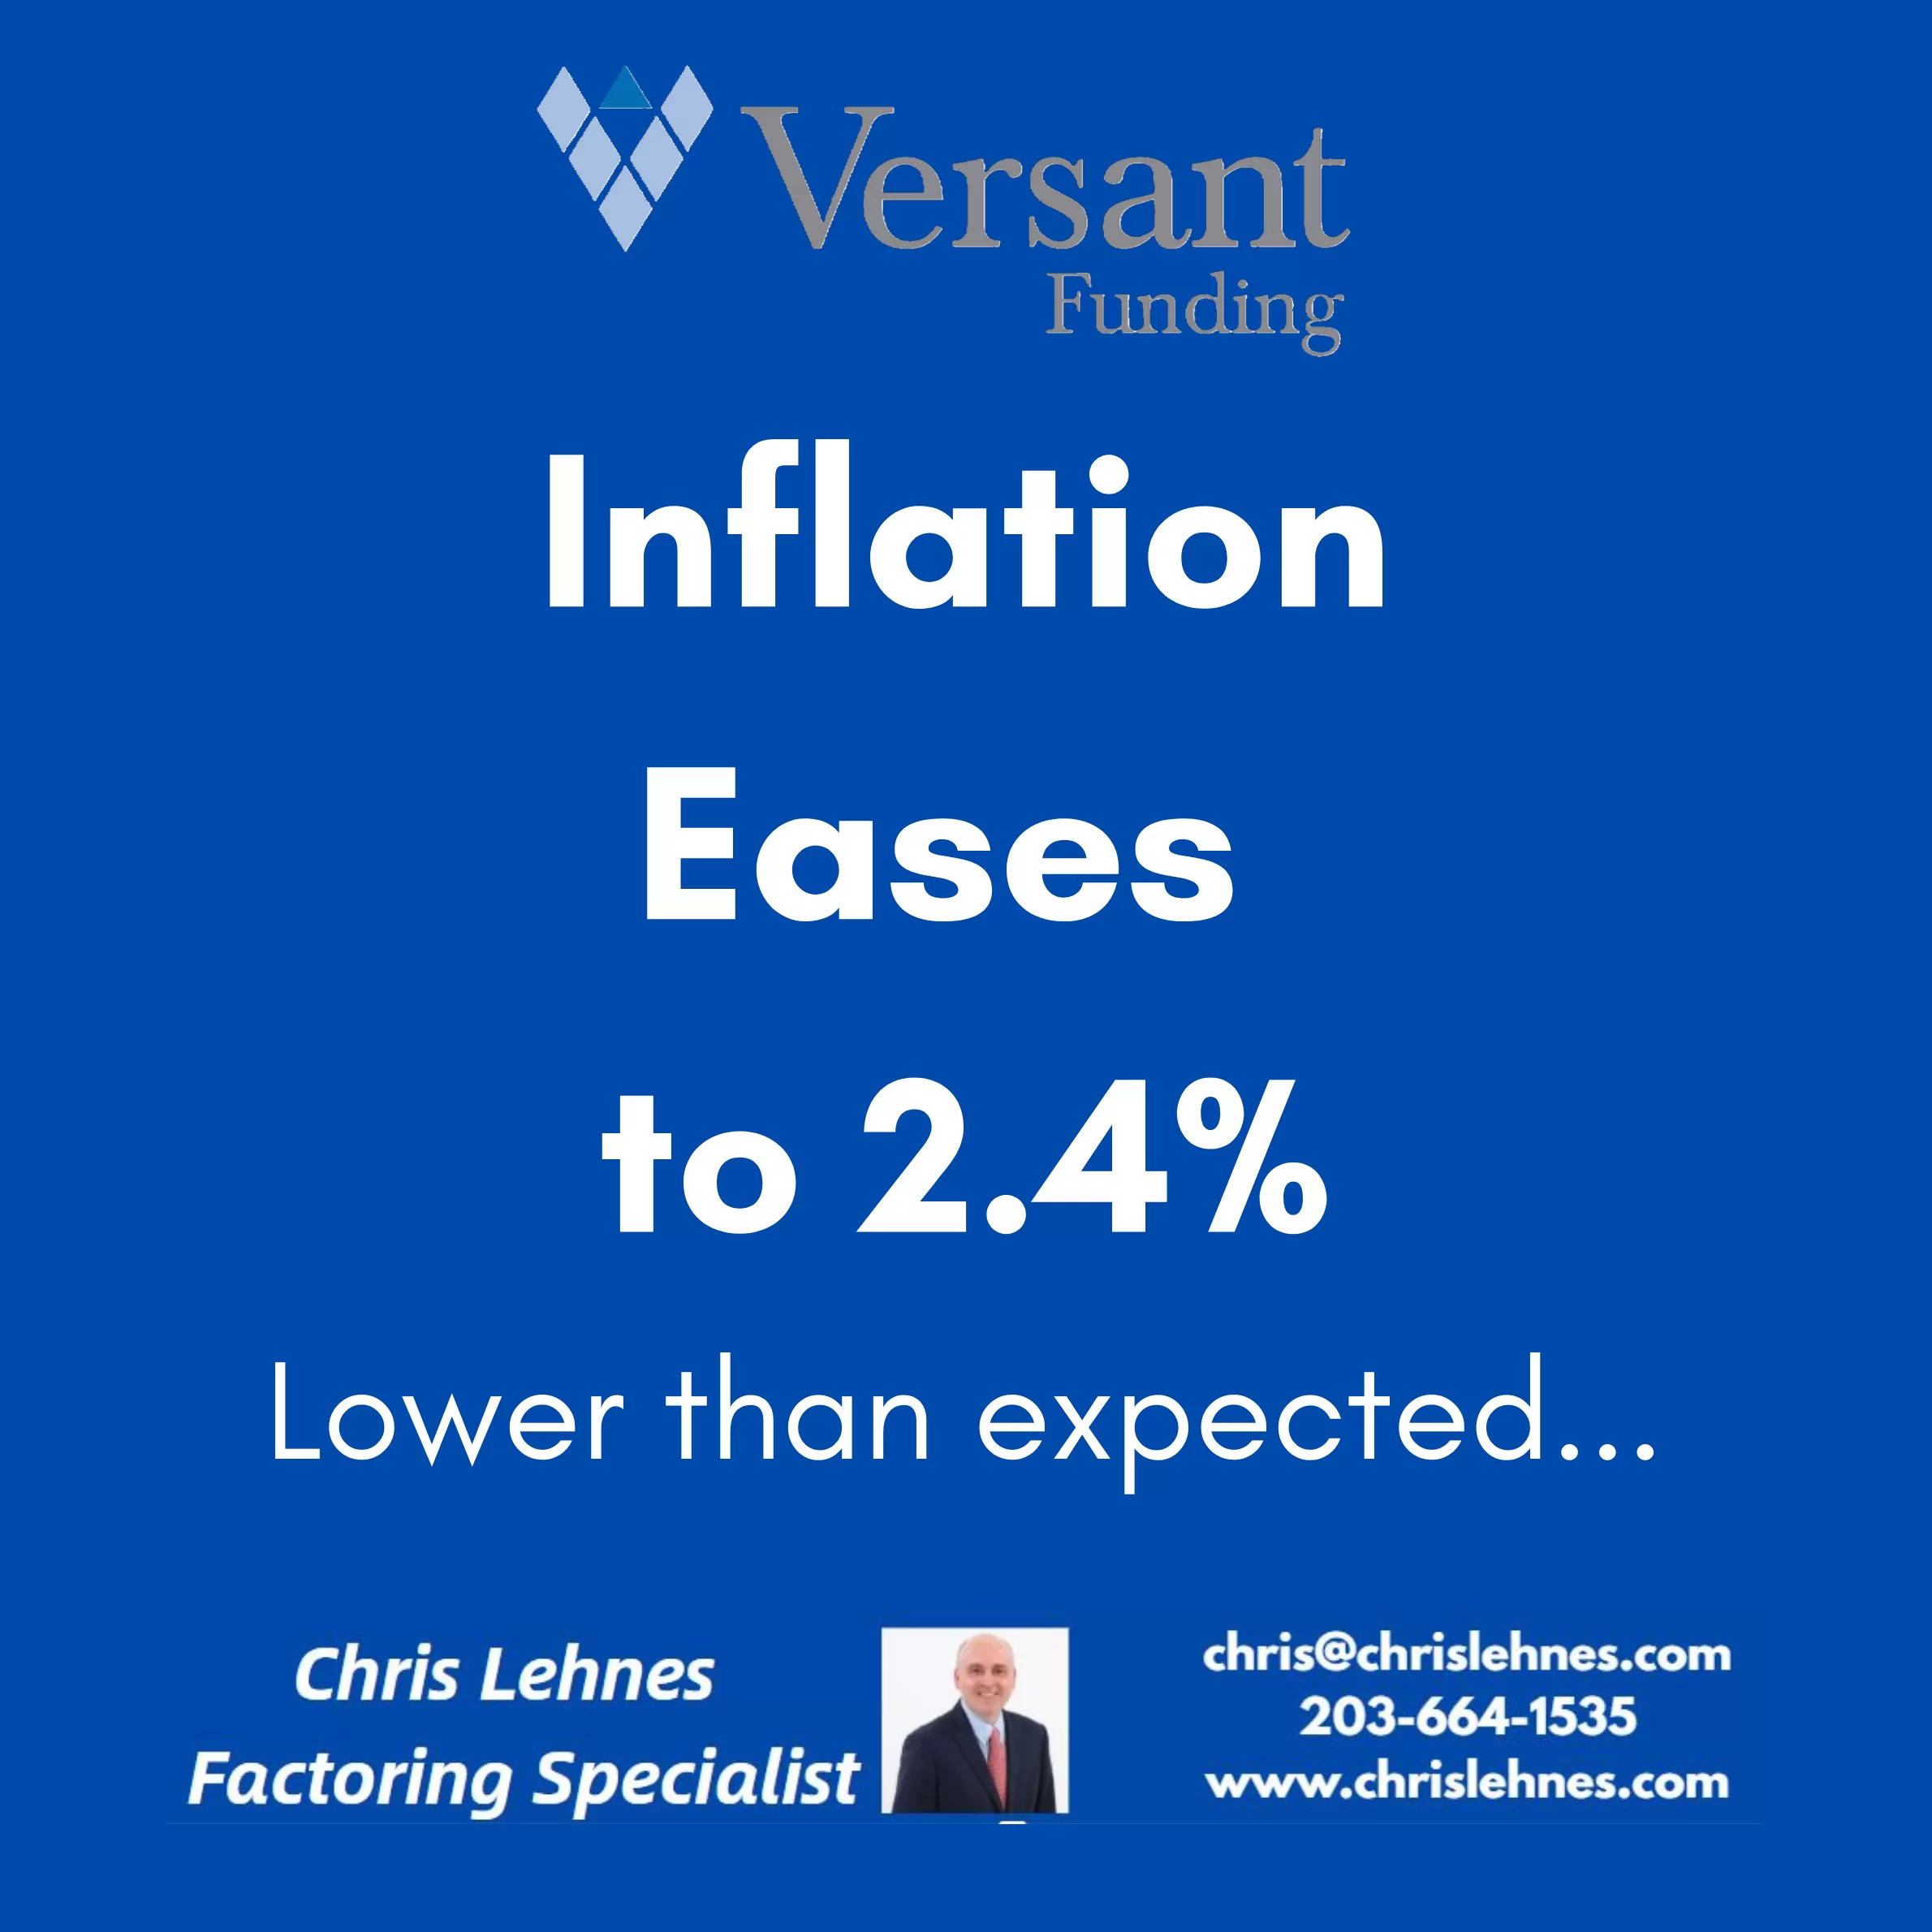
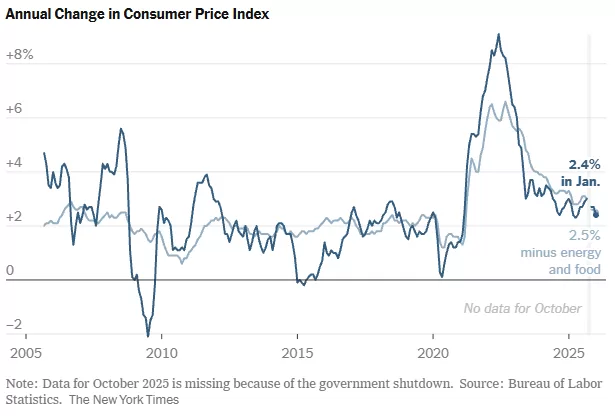
The latest economic data brings a sigh of relief for consumers and policymakers alike, as U.S. inflation has shown a more significant easing than anticipated at the beginning of the year. This positive development suggests that efforts to tame rising prices may be gaining traction, offering a glimmer of hope for greater economic stability in the months to come.
For much of the past year, inflation has been a persistent headwind, impacting everything from grocery bills to housing costs. The robust labor market, while a sign of economic strength, also contributed to upward price pressures. However, recent reports indicate a potential shift in this trend.
Several factors appear to be contributing to this welcome slowdown. Supply chain disruptions, which were a major catalyst for price increases, have largely improved. This has allowed for a more consistent flow of goods, reducing bottlenecks and associated costs. Additionally, the Federal Reserve’s aggressive monetary policy, including multiple interest rate hikes, seems to be having its intended effect of cooling demand and reining in inflationary expectations.
While the easing of inflation is certainly good news, it’s important to maintain a balanced perspective. The economy is a complex system, and various forces are constantly at play. Energy prices, geopolitical events, and shifts in consumer spending habits can all influence the trajectory of inflation. Therefore, continuous monitoring and adaptive policymaking will remain crucial.
What does this mean for the average American? For starters, it could translate into less pressure on household budgets over time. If the trend continues, we might see more stable prices for everyday goods and services, allowing purchasing power to stretch further. It also provides the Federal Reserve with more flexibility in its future policy decisions, potentially reducing the need for further aggressive rate hikes.
The journey to sustained price stability is an ongoing one, but the early signs from this year are undoubtedly encouraging. It’s a testament to the resilience of the U.S. economy and the effectiveness of concerted efforts to address inflationary pressures. As we move further into the year, economists and consumers alike will be watching closely to see if this promising trend continues, paving the way for a more predictable and stable economic environment.
For decades, the path to employment followed a predictable script: graduate high school, earn a four-year degree, and step into a stable career. But for the Class of 2026 and other recent grads, that script has been heavily revised.
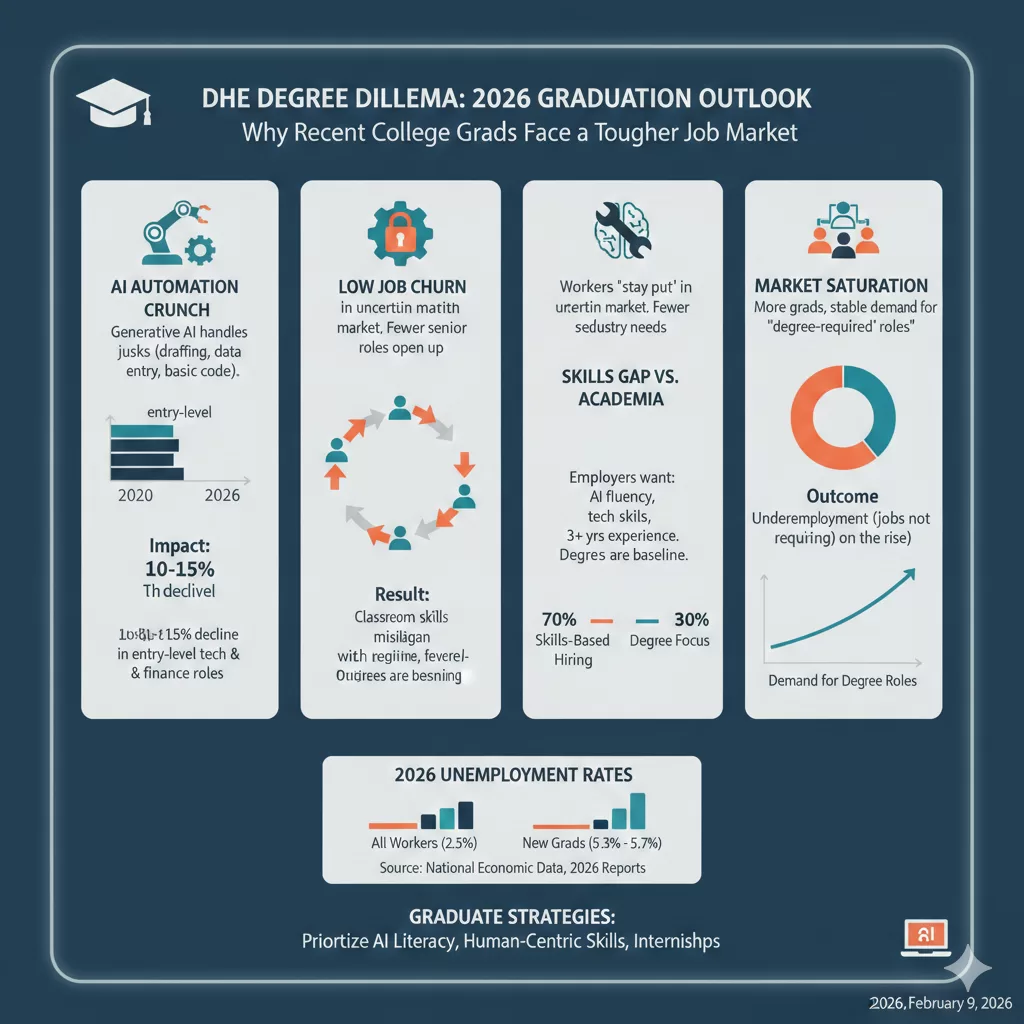
While the national unemployment rate remains relatively stable, a closer look reveals a “white-collar friction” that is hitting young graduates particularly hard. Recent data suggests that unemployment for workers aged 22–27 is significantly higher than for the general population, with some reports showing rates as high as 5.3% to 5.7% for new degree holders compared to just 2.5% for their more experienced counterparts.
Why is the “college advantage” seemingly cooling off? Here are the primary factors reshaping the entry-level landscape.
1. The “Bottom Rung” is Being Automated
Perhaps the most significant shift in 2026 is the impact of Generative AI. Historically, junior roles involved “intellectually mundane” tasks: drafting reports, organizing data, or basic coding. These were the “training wheels” of a career.
Today, AI agents handle these tasks with 90% accuracy in seconds.
The Result: Companies are becoming more “top-heavy.” They still need experienced managers to oversee AI, but they need fewer junior employees to do the legwork.
The Crunch: Entry-level hiring has seen double-digit declines in sectors like tech and finance, as firms use AI to boost productivity without expanding their headcount.
2. The Great “Stay Put” (Low Churn)
In a healthy economy, people switch jobs, creating “openings” at the bottom for new talent. In 2026, we are seeing a collapse in voluntary job switching.
“Workers are holding onto their roles because the market feels risky; as a result, the natural ‘churn’ that usually pulls recent grads into the workforce has stalled.”
When mid-level employees don’t move up or out, the entry-level pipeline remains clogged.
3. The Rising “Skills Gap” vs. Academic Focus
There is a growing disconnect between what is taught in the classroom and what is required in a modern office.
The Degree is the Baseline, Not the Finish Line: Employers are shifting toward skills-based hiring. According to NACE, 70% of employers now prioritize specific technical skills and AI fluency over the prestige of the degree itself.
Experience Over Everything: Job postings that once asked for 0–2 years of experience are increasingly demanding 3+ years or specific internships. For a recent grad, this creates the classic paradox: You can’t get the job without experience, but you can’t get experience without the job.
4. Market Saturation
We are currently seeing the result of “education-neutral” growth. The supply of college graduates has increased steadily, but demand for roles that specifically require a degree has leveled off. This has led to a rise in underemployment, where graduates find themselves in roles that don’t actually require their hard-earned credentials.
What Can Grads Do?
The market is tougher, but it isn’t closed. To stand out in the current environment, graduates must:
Prioritize AI Literacy: It’s no longer a “plus”; it’s a requirement. Show how you use AI to work faster and smarter.
Focus on “Human-Centric” Skills: Emphasize critical thinking, complex problem solving, and emotional intelligence—things AI still struggles to replicate.
Treat Internships as Essential: In 2026, an internship is often the only way to bypass the “3 years of experience” requirement.
Contains information related to marketing campaigns of the user. These are shared with Google AdWords / Google Ads when the Google Ads and Google Analytics accounts are linked together.
90 days
__utma
ID used to identify users and sessions
2 years after last activity
__utmt
Used to monitor number of Google Analytics server requests
10 minutes
__utmb
Used to distinguish new sessions and visits. This cookie is set when the GA.js javascript library is loaded and there is no existing __utmb cookie. The cookie is updated every time data is sent to the Google Analytics server.
30 minutes after last activity
__utmc
Used only with old Urchin versions of Google Analytics and not with GA.js. Was used to distinguish between new sessions and visits at the end of a session.
End of session (browser)
__utmz
Contains information about the traffic source or campaign that directed user to the website. The cookie is set when the GA.js javascript is loaded and updated when data is sent to the Google Anaytics server
6 months after last activity
__utmv
Contains custom information set by the web developer via the _setCustomVar method in Google Analytics. This cookie is updated every time new data is sent to the Google Analytics server.
2 years after last activity
__utmx
Used to determine whether a user is included in an A / B or Multivariate test.
18 months
_ga
ID used to identify users
2 years
_gali
Used by Google Analytics to determine which links on a page are being clicked
30 seconds
_ga_
ID used to identify users
2 years
_gid
ID used to identify users for 24 hours after last activity
24 hours
_gat
Used to monitor number of Google Analytics server requests when using Google Tag Manager