A Surprising Spring: March Jobs Report Shatters Expectations
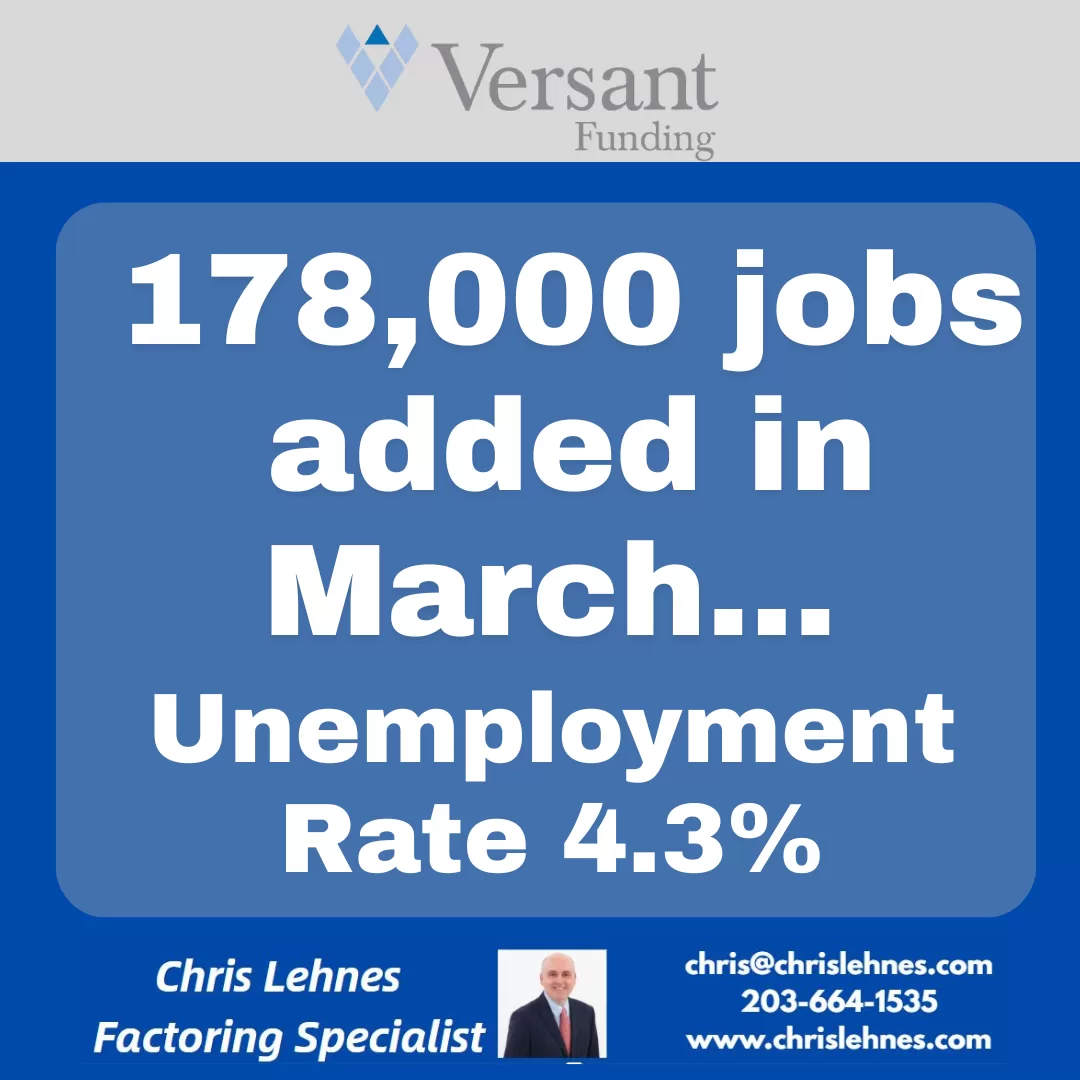
The U.S. labor market just delivered a spring surprise that few saw coming. According to the latest data released today by the Bureau of Labor Statistics (BLS), the U.S. economy added 178,000 jobs in March, vastly outperforming economist forecasts which had hovered around a modest 60,000 to 70,000.
After a dismal February that saw a revised loss of 133,000 jobs, this rebound signals a resilient—if complex—economic landscape.
The Numbers at a Glance
The March report offers a refreshing change of pace for a labor market that has felt “frozen” for much of the past year.
Nonfarm Payrolls: +178,000 (Expected: ~70,000)
Unemployment Rate: 4.3% (Down from 4.4% in February)
Revisions: January’s figures were revised upward to 160,000, though the two-month net revision slightly dampened the overall trend.
What’s Driving the Growth?
The recovery wasn’t uniform across the board. While the headline number is strong, the “engine” of the U.S. economy remains highly concentrated:
The Healthcare Titan: Once again, the health care and social assistance sector did the heavy lifting, adding 76,000 jobs last month. This sector has essentially been the primary life support for the labor market over the last year.
The “Bounce Back” Factor: Part of the March surge is attributed to the return of approximately 31,000 Kaiser Permanente employees who were on strike in February, along with more favorable weather conditions across the country.
The Gender Shift: Interestingly, recent trends show that women now hold more jobs than men in the nonfarm economy—a structural shift driven by the strength of female-dominated sectors like education and health, while male-concentrated sectors like manufacturing continue to cool.
The Shadows on the Horizon: Geopolitics and Oil
Despite the optimistic numbers, experts are urging caution. The report arrives amidst significant geopolitical tension, specifically the ongoing conflict in Iran.
“We’ve got a much more difficult spring job market than we had hoped given the higher prices at the pump and the supply chain disruptions that are going to come from the war,” says Diane Swonk, chief economist at KPMG.
With gas prices spiking above $4 a gallon for the first time since 2022, many fear that the March gains may be a “last hurrah” before the economic impact of the war and energy costs fully settle into corporate hiring plans.
The Bottom Line
The U.S. economy has shown it still has plenty of fight left. A 4.3% unemployment rate remains historically healthy, and the “low-hire, low-fire” stalemate of 2025 appears to be thawing.
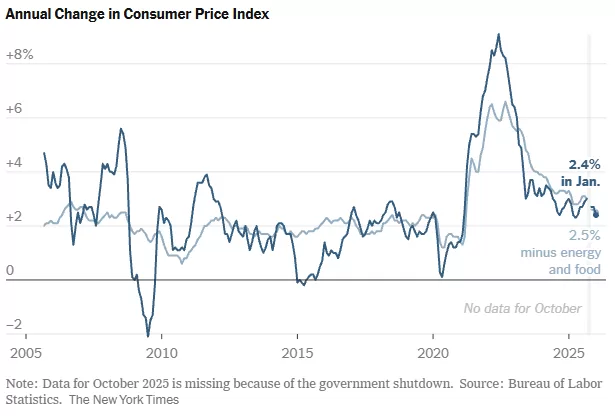
However, for job seekers and businesses alike, the road ahead remains fogged by uncertainty. Between the rapid integration of Artificial Intelligence, fluctuating inflation (which dipped to 2.3% before ticking back up), and global instability, “cautious optimism” remains the phrase of the day.
The final numbers for 2025 are in, and there has been a GDP Downward Revision… they’ve arrived with a bit of a chill. On March 13, 2026, the Bureau of Economic Analysis (BEA) released its second estimate for the fourth quarter of 2025, significantly revising real GDP growth downward to an annualized rate of 0.7%.
This is a sharp departure from the initial “advance” estimate of 1.4% and a massive deceleration from the robust 4.4% growth seen in the third quarter. For the full year, the U.S. economy grew by 2.1%, a slight dip from previous projections.
So, what happened at the end of the year to take the wind out of the economy’s sails?
The Culprits: Shutdowns, Slumps, and Spending
Several factors converged in late 2025 to create this “soft landing” that felt a little more like a bump.
The 43-Day Government Shutdown: The most visible drag was the historic federal government shutdown that spanned October and November. While essential services remained, the lack of federal paychecks and halted government contracts took a measurable bite out of domestic demand.
A “Low-Hire” Labor Market: While mass layoffs weren’t the headline, a “low-hire, low-fire” environment took hold. Monthly job gains slowed to a crawl, and the unemployment rate ticked up to 4.6% by November, making consumers more cautious with their wallets.
The Trade Drag: Exports were revised downward as global demand softened, and a “front-loading” effect—where companies rushed to import goods earlier in the year to avoid new tariffs—faded out, leaving a gap in activity for the final months.
Sticky Inflation: Despite the slower growth, the PCE price index (the Fed’s favorite inflation gauge) remained at 2.9%. This combination of stagnant growth and persistent inflation has put the Federal Reserve in a difficult “wait-and-see” position.
Silver Linings in the Data
It’s not all doom and gloom. Even with the downward revision, there are signs of underlying resilience:
Investment is Picking Up: While consumer spending moderated, business investment—particularly in AI infrastructure—actually accelerated in Q4, acting as a critical floor for the economy.
Market Resilience: Interestingly, Wall Street took the news in stride. Markets actually rallied following the release, as investors bet that the soft GDP data would finally force the Federal Reserve to consider more aggressive rate cuts later in 2026.
Recouping the Loss: Economists expect much of the “lost” output from the government shutdown to be recovered in the first half of 2026 as backlogged projects and federal spending finally hit the books.
What’s Next for 2026?
The downward revision confirms that the “Goldilocks” era of high growth and falling inflation has hit a snag. Most forecasters, including the IMF and S&P Global, now project a steady but modest growth rate of around 1.8% to 2.0% for 2026.
The big question remains the Federal Reserve. With growth at 0.7% but inflation still above their 2% target, the path to interest rate cuts remains narrow. For now, the “wait-and-see” approach is the only game in town.
1. The Tech Sector: From Growth to Efficiency
While the broader economy slowed, Tech remained a relative fortress, but the “flavor” of investment is changing.
AI Infrastructure as a Life Raft: Business investment in “Intellectual Property Products” (tech speak for software and AI R&D) was one of the few areas that actually accelerated in Q4 2025. Companies are doubling down on AI to find the efficiencies they need to survive a low-growth environment.
The “Low-Hire” Reality: Expect the “low-hire” trend to persist in Silicon Valley. With GDP growth revised downward, tech giants are focusing on “AI-driven productivity” rather than aggressive headcount expansion.
Valuation Pressure: While the stock market has been resilient, persistent 2.9% inflation means the Federal Reserve isn’t in a rush to slash rates. High-growth tech stocks are sensitive to interest rates; if those rates stay “higher for longer,” we may see more volatility in tech valuations throughout 2026.
2. The Real Estate Market: A Tale of Two Interests
The GDP Downward Revision has created a paradoxical situation for housing.
Mortgage Rate Relief? Traditionally, weak GDP data pushes bond yields down, which can lower mortgage rates. Many analysts now expect the 30-year fixed rate to drift toward 6.0%–6.2% in 2026. This could finally “unlock” homeowners who have been trapped by high rates.
The “Sentiment” Gap: The revision highlights a cooling labor market (unemployment at 4.6%). Even if mortgage rates drop, buyer “jitters” may keep the market from exploding. J.P. Morgan research suggests national home prices may stall at 0% growth in 2026 as demand and supply reach a fragile equilibrium.
Commercial Real Estate (CRE) Stress: The 0.7% GDP print is toughest on office and retail CRE. Slower economic activity means less demand for physical space, likely leading to more “strategic defaults” or building repurposing projects in 2026.
The Federal Reserve’s “Tightrope”
The GDP Downward Revision puts the Fed in a bind. Usually, 0.7% growth would trigger an immediate rate cut to “save” the economy. However, with inflation still at 2.9%, they risk reigniting price hikes if they move too fast.
The Bottom Line: 2026 will be the year of the “Efficiency Play.” Whether you are a tech firm or a homebuyer, the goal is no longer “growth at any cost,” but rather finding value in a slower, more deliberate economic landscape.
Headline: 📉 GDP Revised to 0.7%: What it means for Tech & Real Estate in 2026.
The “Second Estimate” for Q4 2025 is out, and the numbers confirm a significant cooling of the U.S. economy. Real GDP growth was revised down to an annualized 0.7%—a sharp drop from the earlier 1.4% estimate.
While the 43-day government shutdown in late 2025 played a major role, the ripple effects for 2026 are already taking shape:
💻 TECH: The era of “growth at any cost” is officially over. We’re seeing a pivot toward Efficiency Tech. While broader spending is cooling, investment in AI infrastructure is accelerating as companies scramble to automate their way out of a low-growth environment.
🏠 REAL ESTATE: It’s a paradox. Slower growth usually means lower mortgage rates, and we’re already seeing 30-year fixed rates dip toward 6.0%. However, with unemployment ticking up to 4.6%, buyer “jitters” are real. J.P. Morgan predicts a 0% national price growth for 2026—a true flatline.
⚖️ THE FED: Chair Jerome Powell and the FOMC are walking a tightrope. With inflation still “sticky” at 2.4%–2.9%, they can’t rush to cut rates despite the sub-1% growth.
The Bottom Line: 2026 will reward the “Lean and Leaner.” Whether you’re managing a portfolio or a product roadmap, efficiency is the new growth.
1/ 🚨 BREAKING: U.S. Q4 2025 GDP revised DOWN to 0.7% (from 1.4%). The 2025 “Cold Snap” is official. Here’s the 30-second breakdown of what this means for your wallet in 2026. 🧵👇
2/ Why the drop? The 43-day government shutdown was a massive anchor, but we also saw a deceleration in consumer spending and exports. The economy didn’t crash, but it definitely pulled the emergency brake. 🛑
3/ 💻 TECH IMPACT: Silicon Valley is staying “Low-Hire.” With 0.7% growth, companies are prioritizing AI-driven productivity over expansion. If it doesn’t automate a process or save a dollar, it’s not getting funded this year.
4/ 🏠 HOUSING IMPACT: Good news? Mortgage rates are sliding toward 5.8%–6.0%. Bad news? A weaker labor market means fewer people are ready to jump. Expect a “sideways” year for home prices. 📉➡️
5/ 🏦 FED WATCH: All eyes on the March 18 FOMC meeting. The market was hoping for cuts, but with inflation at 2.4%, the Fed might stay “Higher for Longer” to ensure the fire is out.
6/Summary: 2026 is the year of the “Efficiency Play.” Growth is slow, money is still relatively expensive, and AI is the only engine still revving. Stay nimble. #GDP #Economy #Inflation
📸 Instagram/Threads: The Visual Summary
Caption:
The numbers are in: The U.S. economy hit a “speed bump” at the end of 2025. 📉 GDP growth was just revised down to 0.7%.
What this means for you: ✅ Mortgage Rates: Might actually get a bit friendlier (seeing 5.8% – 6% averages). ✅ Tech: More AI tools, fewer new job postings. Efficiency is 👑. ✅ Inflation: Still hanging around 2.4%, keeping the Fed on high alert.
It’s not a recession—it’s a recalibration. 2026 is about playing the long game. ♟️
If you’ve noticed your Costco hauls getting a little pricier over the last year due to tariff passthrough, you aren’t alone. But a new legal battle is brewing that asks a multi-billion-dollar question: If a retailer gets a refund for the “illegal” tariff they passed on to you, who actually keeps the cash?
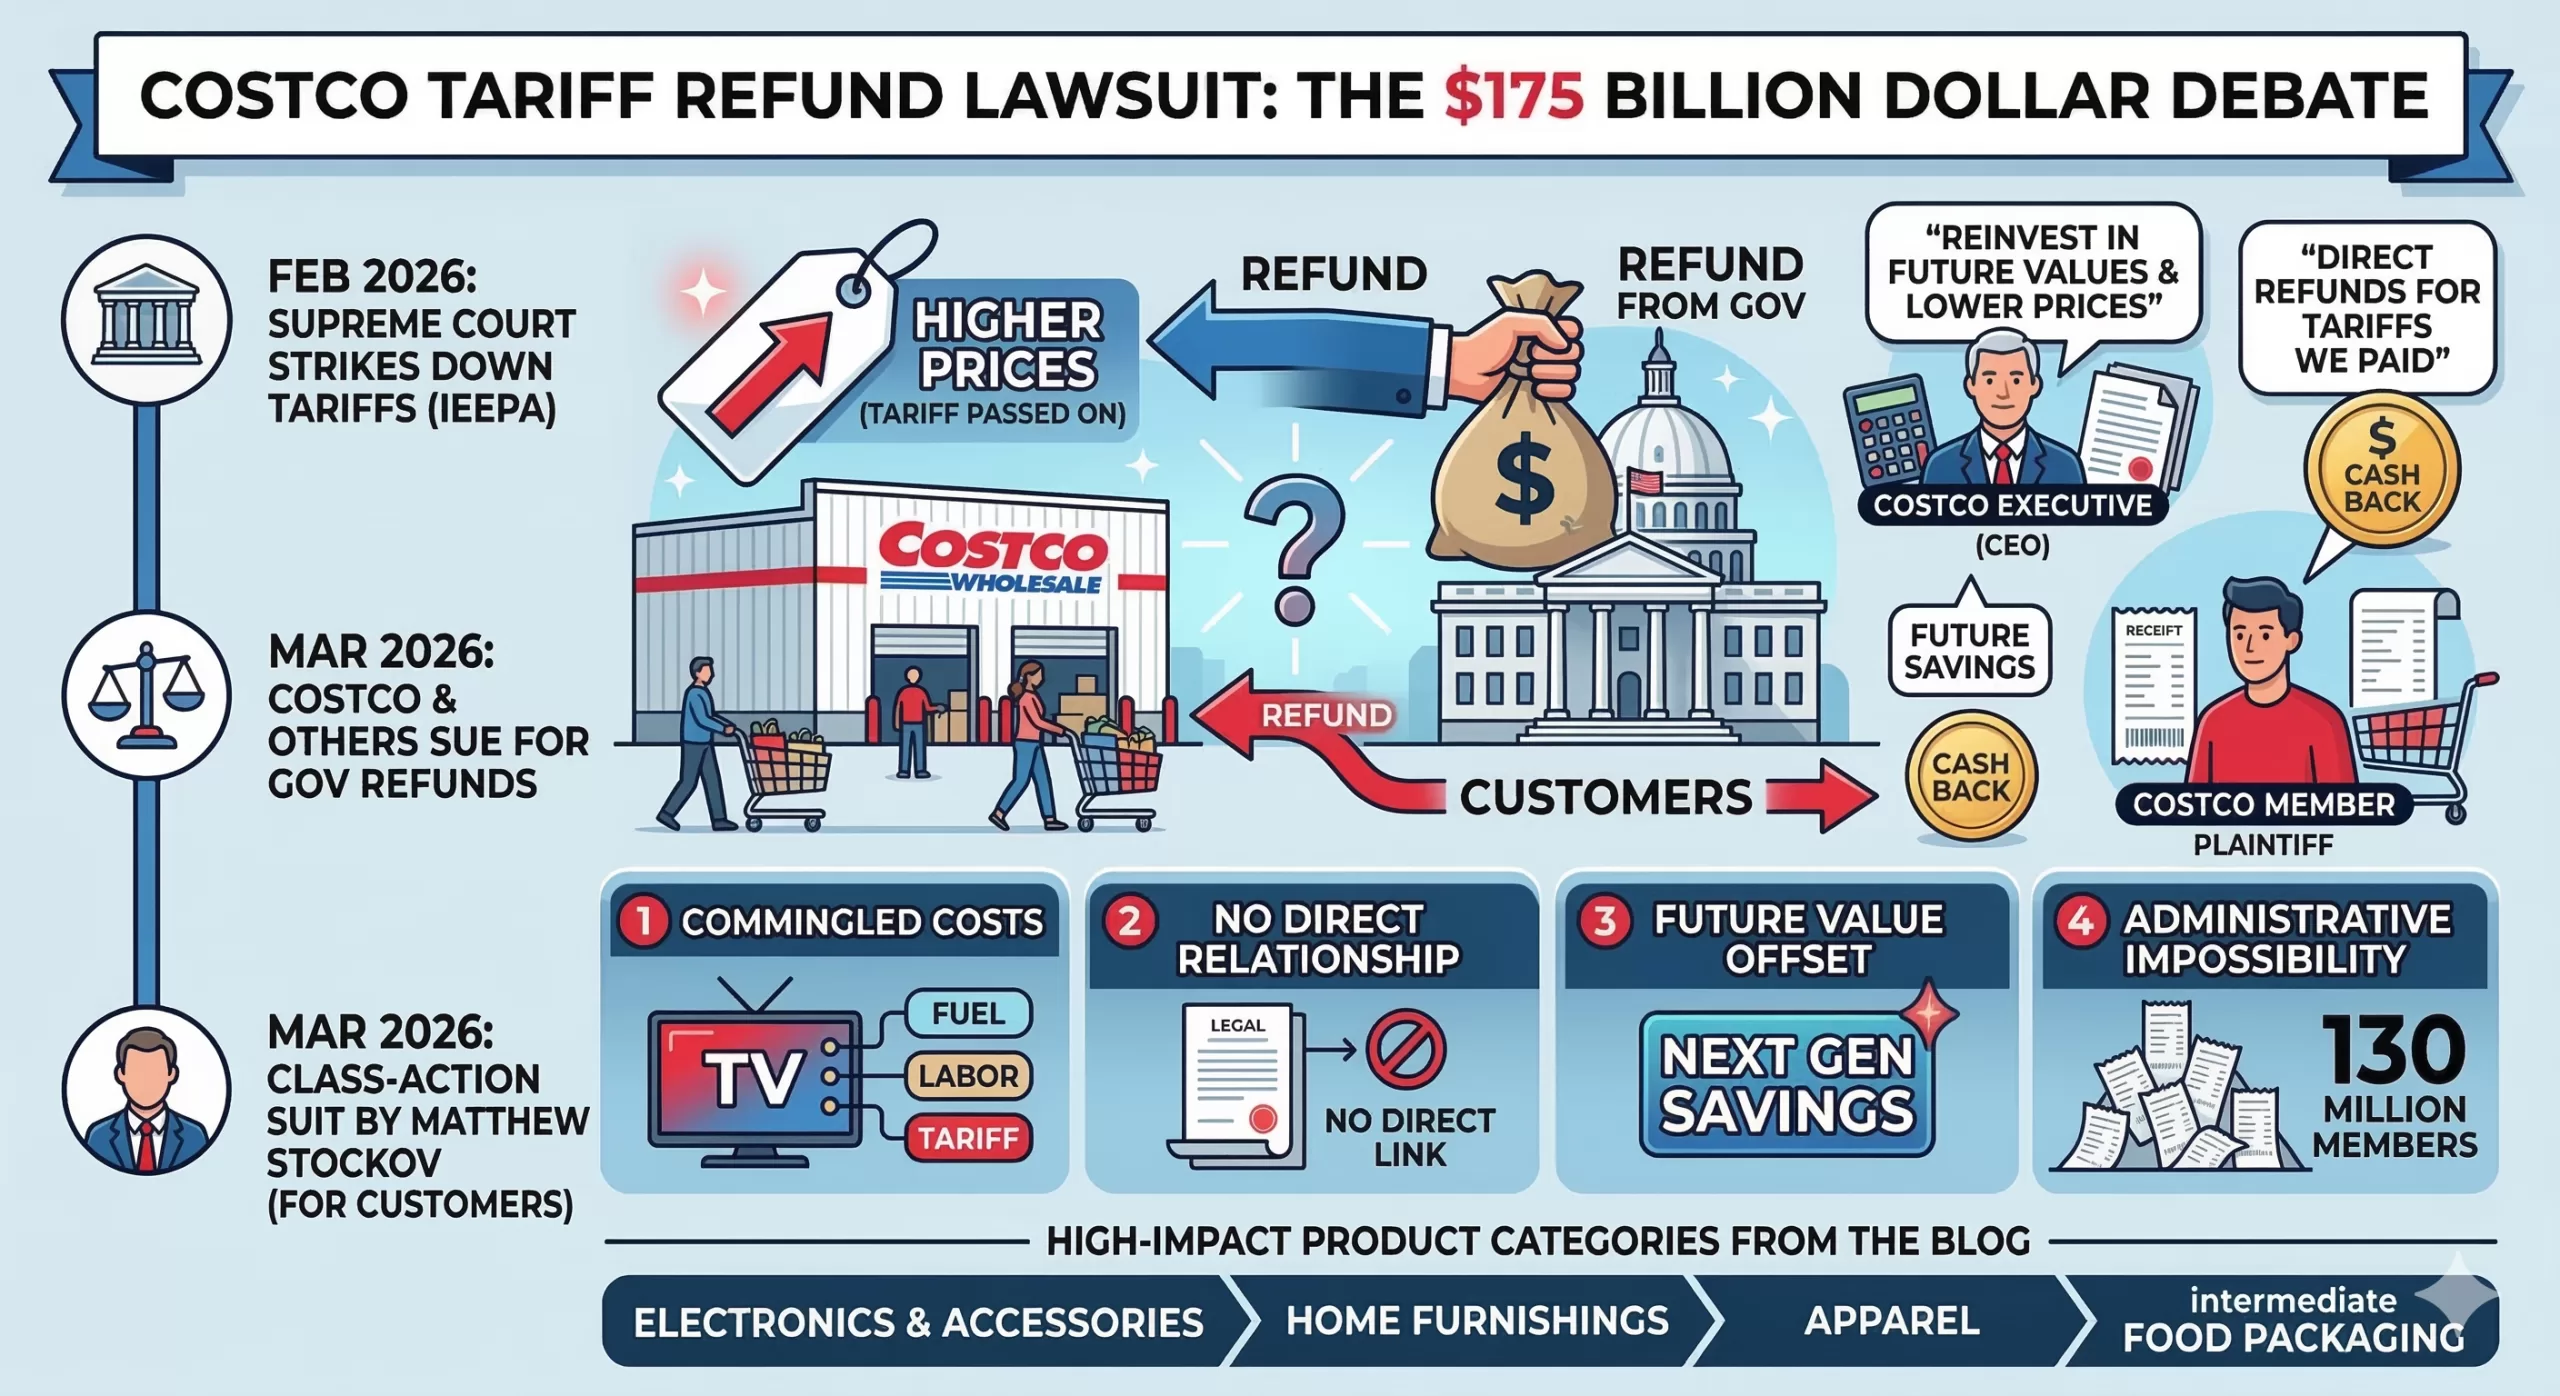
On Wednesday, March 11, 2026, a Costco member in Illinois filed a nationwide class-action lawsuit against the retail giant. The goal? To ensure that any tariff refunds Costco receives from the federal government end up back in the pockets of the shoppers who actually paid for them.
The Backdrop: A Supreme Court Shake-up
The drama started on February 20, 2026, when the U.S. Supreme Court ruled that the sweeping worldwide tariffs imposed last year under the International Emergency Economic Powers Act (IEEPA) were unlawful. The Court found that the executive branch had overstepped its authority, effectively turning roughly $130 billion to $175 billion in collected duties into a massive pot of refundable money.
Immediately, over 2,000 companies—including Costco—filed their own lawsuits against the government to claw that money back.
The Conflict: “Double Recovery” vs. “Better Value”
The new consumer lawsuit, led by plaintiff Matthew Stockov, argues that Costco acted as a “pass-through vehicle.” The logic is simple:
The Hike: Costco raised prices on electronics, household goods, and food to cover the cost of the tariffs.
The Refund: Now that the tariffs are struck down, Costco is suing the government to get that money back.
The “Double Dip”: If Costco keeps the refund and the extra money they already collected from shoppers via higher prices, the lawsuit alleges they are “unjustly enriched” at the expense of their members.
Costco CEO Ron Vachris recently addressed the situation, stating the company’s commitment is to return value to members through “lower prices and better values” in the future.
However, the lawsuit isn’t buying it. The legal team argues that a promise of future discounts for future shoppers doesn’t compensate the specific people who paid the “tariff tax” last year. They want direct restitution.
Is a Refund Actually Coming?
While the Supreme Court ruling is a win for importers, getting cash into the hands of individual shoppers is a legal uphill battle. Here is why:
Standing: Under federal trade law, only the “importer of record” (Costco) has the legal right to claim a refund from the government.
The Math: Proving exactly how much of a $0.50 price hike on a rotisserie chicken was due to a specific tariff vs. inflation or supply chain issues is a forensic accounting nightmare.
The Contract: Legal experts note that when you buy an item, the “contract” is the price on the tag. Retailers generally aren’t legally obligated to refund you if their internal costs go down later.
What’s Next?
Costco isn’t the only one in the crosshairs. Similar suits have been filed against FedEx and EssilorLuxottica (the makers of Ray-Ban).
If the court certifies this as a class action, it could set a massive precedent for how “corporate windfalls” are handled after major policy reversals. For now, Costco members should keep their receipts—and their eyes on the Court of International Trade.
If Costco decides to fight this in court rather than settle, their legal team will likely lean on a defense built around retail economics and contract law.
Here are the four “pillars” of defense they are expected to use:
1. The “Commingled Costs” Argument
Retail pricing isn’t a simple $1+1=2$ equation. When Costco raises the price of a television, that hike accounts for shipping fuel, labor, warehouse rent, insurance, and tariffs. Costco will likely argue that it is mathematically impossible to isolate exactly how many cents of a price increase were “just” for the tariff. Since the costs were commingled, they may argue that specific “tariff surcharges” were never actually charged to the customer.
2. Lack of “Privity” (Direct Relationship)
In trade law, the “Importer of Record” is the only entity with a legal relationship to U.S. Customs.
Costco’s stance: We paid the government; the government owes us.
The logic: There is no contract between Costco and a member that promises to pass through government refunds. When you buy a jar of almond butter, you agree to the price on the tag at that moment, regardless of Costco’s internal cost fluctuations.
3. The “Future Value” Offset
CEO Ron Vachris has already hinted at this strategy. Costco may argue that they are already fulfilling their duty to members by using anticipated refunds to lower prices across the board today. By proving they are reinvesting the money into “better values,” they can claim they are not being “unjustly enriched”—the core requirement for the plaintiff to win.
4. Administrative Impossibility
Costco has over 130 million members. Tracking every single purchase of tariff-affected goods (from socks to patio furniture) over a multi-year period and issuing individual checks would be an administrative nightmare that could cost more than the refunds themselves. They may argue that a “cy-près” award (like a general price drop or a donation to a relevant cause) is a more legal and practical remedy than individual refunds.
Comparison of Arguments
Argument
Plaintiff’s View (Shoppers)
Defense View (Costco)
Enrichment
Costco gets a “double recovery” (shoppers’ money + gov refund).
Costco is a low-margin business that “returns value” via lower future prices.
Pricing
Prices went up specifically because of tariffs.
Prices are set by market competition and total operating costs.
Equity
The specific people who paid the “tax” should get the cash.
It is impossible to track individual “tariff cents” per member.
While Costco is currently the primary target of this specific class-action pressure, other major retailers like Walmart and Target are taking noticeably different approaches to the $175 billion tariff refund opportunity.
Here is how the other giants are positioning themselves:
1. Walmart: The “Conservative Pivot”
Walmart has been more cautious in its public statements regarding specific consumer refunds. Instead of promising direct returns, they are focusing on their role as a “price stabilizer.”
The Strategy: During their recent February 2026 earnings call, Walmart leadership noted they are using their massive scale to absorb costs. Their official stance is that because they negotiate long-term contracts and used “inventory pull-forward” strategies to avoid the worst of the tariffs, they didn’t pass through costs as directly as others.
The Defense: They are positioning any potential refunds as “capital for reinvestment” into their operations and employees, which they argue ultimately benefits customers through lower prices over the long term.
2. Target: The “Supplier Squeeze”
Target’s response has been more aggressive toward its supply chain rather than the federal government.
The Strategy: Target made headlines earlier this year by reportedly asking its Chinese suppliers to absorb up to 50% of the tariff costs to keep shelf prices stable.
The Stance: Because Target forced suppliers to eat much of the cost, they may argue that they aren’t the ones owed the full refund—or that since they didn’t raise prices as much as competitors, there is no “excess profit” to return to consumers.
3. FedEx & UPS: The “Direct Pass-Through” Exception
Unlike retailers where tariff costs are buried in the price of a gallon of milk, shipping companies like FedEx and UPS often used explicit line-item surcharges labeled as “Tariff Fees.”
The Vulnerability: Because these fees were itemized, these companies are facing the most direct legal heat. FedEx has indicated in recent filings that if they receive refunds, they have a framework to pass them back to the original shippers, though the logistics of reaching the end consumer remain a “mess.”
Summary of Retailer Responses
Retailer
Public Stance on Refunds
Primary Defense
Costco
“Future value” through lower prices and better deals.
Administrative impossibility of tracking individual cents.
Walmart
Focused on reinvesting refunds into business operations.
Scaled absorption—claims they didn’t pass through 1:1 costs.
Target
Silent on customer refunds; focused on supplier negotiations.
Argues suppliers bore the cost burden, not just the retailer.
FedEx
Exploring pass-throughs for itemized surcharges.
Contractual obligations to the “shipper of record.”
Why the National Retail Federation (NRF) is Worried
The NRF, which represents all three of these companies, has called for a “seamless and automatic” refund process from the government. However, they are lobbying hard against the idea that retailers must “prove” they passed the money back to consumers, calling such requirements an “accounting nightmare” that would stall the economic boost the refunds are intended to provide.
While the lawsuit filed by Matthew Stockov seeks a blanket refund for “all affected products,” the actual legal battle centers on specific goods that were hit by the International Emergency Economic Powers Act (IEEPA) tariffs.
Because Costco sells such a wide variety of items, the impact is spread across several high-volume categories. Here are the product types most likely to be at the heart of the refund calculations:
1. Electronics and Accessories
This is a massive category for Costco and one of the hardest hit by the reciprocal tariffs.
Small Tech: Laptop bags, charging cables, and power banks.
Peripherals: Computer mice, keyboards, and monitors.
Smart Home: Security cameras and small connected appliances.
Note: Some major electronics (like certain computers) were protected under different trade laws, but “intermediate” components and accessories were often taxed at the full IEEPA rate.
2. Home Furnishings and Hard Goods
Furniture retailers have been among the first to join the “refund clamor.”
Large Furniture: Sofas, dining sets, and patio furniture.
Home Decor: Rugs, textiles, and lighting fixtures.
Kitchenware: Cookware sets and small appliances (like air fryers or coffee makers) imported from affected regions.
3. Apparel and Footwear
These items saw some of the most significant price fluctuations over the last 12 months.
Clothing: “Fast fashion” items, activewear, and outerwear.
Shoes: Sneakers and boots, particularly those where the supply chain relies heavily on international sourcing.
4. Food and Intermediate Packaging
This is the most complex category for Costco to untangle.
Imported Specialties: Specific wines, spirits, and olive oils that were subject to geopolitical surcharges.
Packaging Costs: Even for “American-made” products, the tariffs often applied to the packaging (plastic containers, coffee filters, or baby wipe canisters) imported from abroad. Proving how a tariff on a plastic tub affected the price of the 5-pound tub of animal crackers is a key hurdle for the lawsuit.
What is NOT Included?
It’s important to note that many items at Costco were taxed under different laws (like Section 232 or Section 301), which the Supreme Court did not strike down. You likely won’t see refunds for:
Steel and Aluminum products (including some appliances and car parts).
Specific Chinese-made goods covered under long-standing trade war sections.
Summary Table: Refund Potential by Category
Product Category
Refund Potential
Why?
Electronics Acc.
High
Many were hit with the 2025 “reciprocal” 10-25% tariffs.
Furniture
High
Home goods were a primary target for IEEPA-based levies.
Apparel
Medium
High volume, but often split between different tariff authorities.
Groceries
Low
Most food price hikes were tied to inflation/labor, not just tariffs.
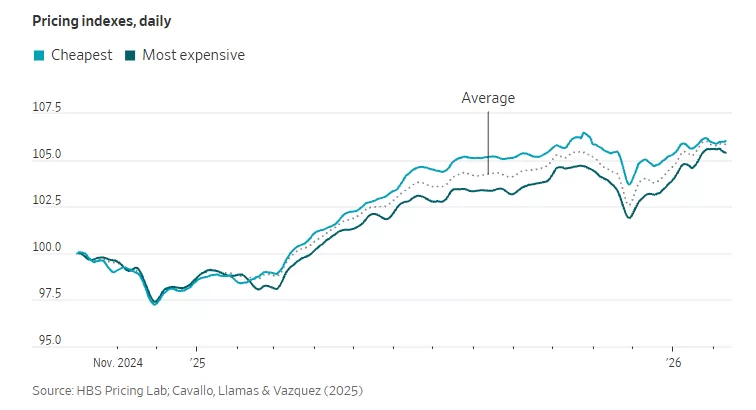
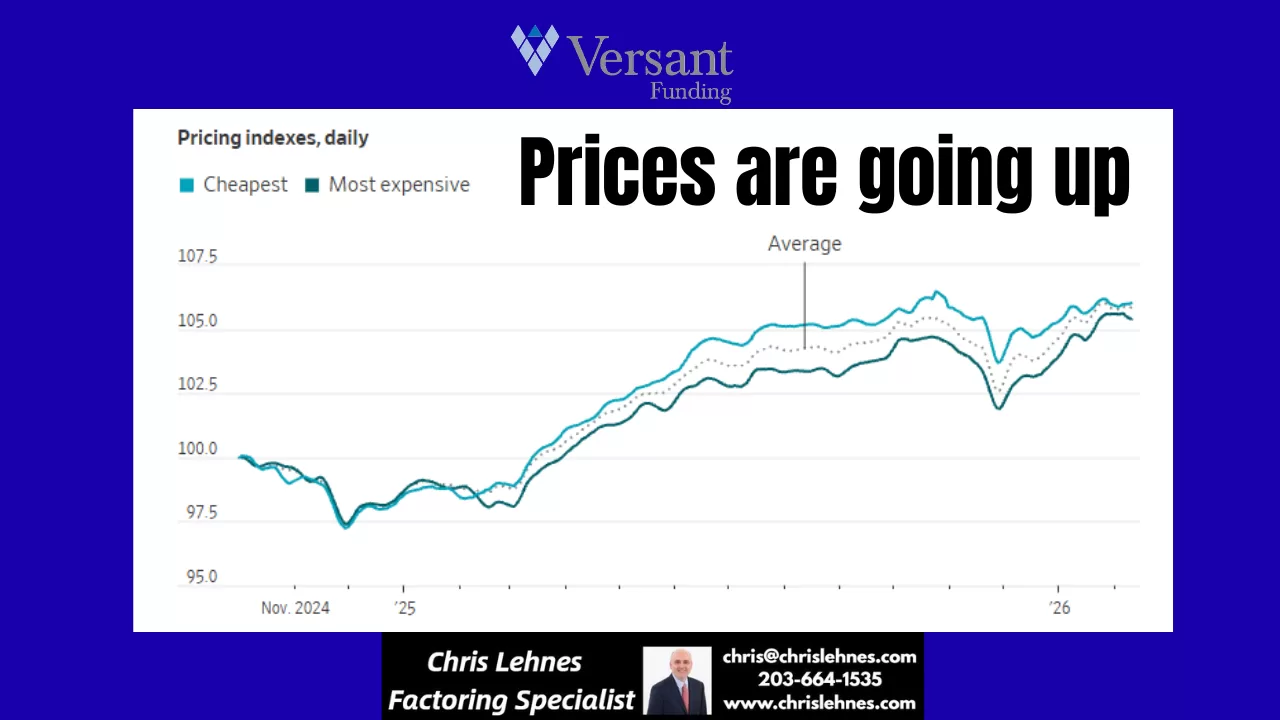
Remember that brief sigh of relief? The one where it felt like maybe, just maybe, the relentless march of price increases was slowing down? Well, if you’ve been to the grocery store, filled up your gas tank, or even just browsed online recently, you’ve probably noticed it: the break is over. Companies are jacking up prices again, and consumers are once again feeling the pinch.
For a while, many economists and analysts pointed to easing supply chain issues, stabilizing energy costs, and even a slight dip in consumer demand as potential signals that inflation was cooling. Some businesses even held the line on prices, perhaps hoping to retain market share or out of a genuine desire to give their customers a break.
But those days seem to be largely behind us. We’re seeing a resurgence in price hikes across a wide array of sectors. From everyday necessities to discretionary items, the numbers on the tags are climbing.
What’s Driving This Latest Surge?
Several factors are likely contributing to this renewed upward trend:
Persistent Input Costs: While some raw material costs have stabilized, others continue to be elevated. Labor costs are also a significant factor, with many businesses facing pressure to offer higher wages to attract and retain employees. These increased operational expenses often get passed on to the consumer.
Strong Consumer Demand (Still): Despite earlier predictions of a significant slowdown, consumer demand has proven remarkably resilient in many areas. When demand remains high, businesses have less incentive to lower prices and more leeway to raise them.
“Catch-Up” Pricing: Some companies might feel they absorbed increased costs for a period and are now playing catch-up, adjusting prices to reflect their sustained operational expenses.
Geopolitical Factors: Global events continue to create volatility in commodity markets, particularly for energy and certain raw materials, which inevitably impacts production and transportation costs.
Profit Margins: Let’s be honest, businesses are in the business of making a profit. If they perceive an opportunity to increase their margins without significantly impacting sales volume, many will take it.
What Does This Mean for You?
For the average household, this renewed wave of price increases means a continued squeeze on budgets. Discretionary spending may need to be curtailed further, and even essential purchases will require more careful planning. Savings might deplete faster, and the goal of financial stability could feel increasingly distant.
How Can Consumers Cope?
While we can’t control the broader economic forces at play, there are strategies consumers can employ to mitigate the impact:
Become a Savvy Shopper: Compare prices diligently, look for sales and discounts, and consider generic or store-brand alternatives.
Budgeting is Key: Revisit your budget and identify areas where you can cut back. Track your spending to understand exactly where your money is going.
Prioritize Needs vs. Wants: Distinguish between essential purchases and items that can be deferred or eliminated.
Support Local (Where Affordable): Sometimes local businesses, with lower overheads, can offer competitive pricing, or at least you’re supporting your community.
Advocate for Yourself: When possible, negotiate prices for services, or look for loyalty programs that offer discounts.
The “break” from rising prices was indeed short-lived. As companies continue to adjust their pricing strategies, it’s more important than ever for consumers to be vigilant, adapt their spending habits, and advocate for their financial well-being.
In a surprising turn of events, German factory orders in have shown an unexpected and robust surge, signaling a potentially stronger-than-anticipated rebound in the nation’s industrial sector. This latest data has instilled a renewed sense of optimism among economists and policymakers, suggesting that Europe’s largest economy might be on a more solid recovery path than previously estimated.
The Federal Statistical Office announced this morning that new factory orders jumped by a significant margin in the past month, far exceeding analyst expectations. This remarkable uptick follows a period of cautious growth and even some contractions, making the current surge all the more impactful. The increase was broad-based, with both domestic and international orders contributing substantially to the overall rise.
A Deeper Dive into the Numbers
The reported increase in orders was particularly driven by strong demand for capital goods, indicating that businesses are investing more in machinery and equipment – a key indicator of future production capacity and confidence. Intermediate goods also saw a healthy boost, suggesting renewed activity across various supply chains.
Economists are pointing to several factors contributing to this positive development. A resilient global demand, particularly from key trading partners, appears to be playing a significant role. Furthermore, a gradual easing of supply chain bottlenecks, which have plagued manufacturers for months, is allowing companies to fulfill orders more efficiently and take on new business.
Impact on the Broader Economy
This unexpected surge in factory orders is a shot in the arm for the German economy, which has been grappling with persistent inflation and the lingering effects of global uncertainties. A strong industrial sector is crucial for Germany’s economic health, as it is a major employer and a significant contributor to GDP. The improved outlook could lead to increased hiring, higher wages, and ultimately, stronger consumer spending.
The latest economic data brings a sigh of relief for consumers and policymakers alike, as U.S. inflation has shown a more significant easing than anticipated at the beginning of the year. This positive development suggests that efforts to tame rising prices may be gaining traction, offering a glimmer of hope for greater economic stability in the months to come.
For much of the past year, inflation has been a persistent headwind, impacting everything from grocery bills to housing costs. The robust labor market, while a sign of economic strength, also contributed to upward price pressures. However, recent reports indicate a potential shift in this trend.
Several factors appear to be contributing to this welcome slowdown. Supply chain disruptions, which were a major catalyst for price increases, have largely improved. This has allowed for a more consistent flow of goods, reducing bottlenecks and associated costs. Additionally, the Federal Reserve’s aggressive monetary policy, including multiple interest rate hikes, seems to be having its intended effect of cooling demand and reining in inflationary expectations.
While the easing of inflation is certainly good news, it’s important to maintain a balanced perspective. The economy is a complex system, and various forces are constantly at play. Energy prices, geopolitical events, and shifts in consumer spending habits can all influence the trajectory of inflation. Therefore, continuous monitoring and adaptive policymaking will remain crucial.
What does this mean for the average American? For starters, it could translate into less pressure on household budgets over time. If the trend continues, we might see more stable prices for everyday goods and services, allowing purchasing power to stretch further. It also provides the Federal Reserve with more flexibility in its future policy decisions, potentially reducing the need for further aggressive rate hikes.
The journey to sustained price stability is an ongoing one, but the early signs from this year are undoubtedly encouraging. It’s a testament to the resilience of the U.S. economy and the effectiveness of concerted efforts to address inflationary pressures. As we move further into the year, economists and consumers alike will be watching closely to see if this promising trend continues, paving the way for a more predictable and stable economic environment.
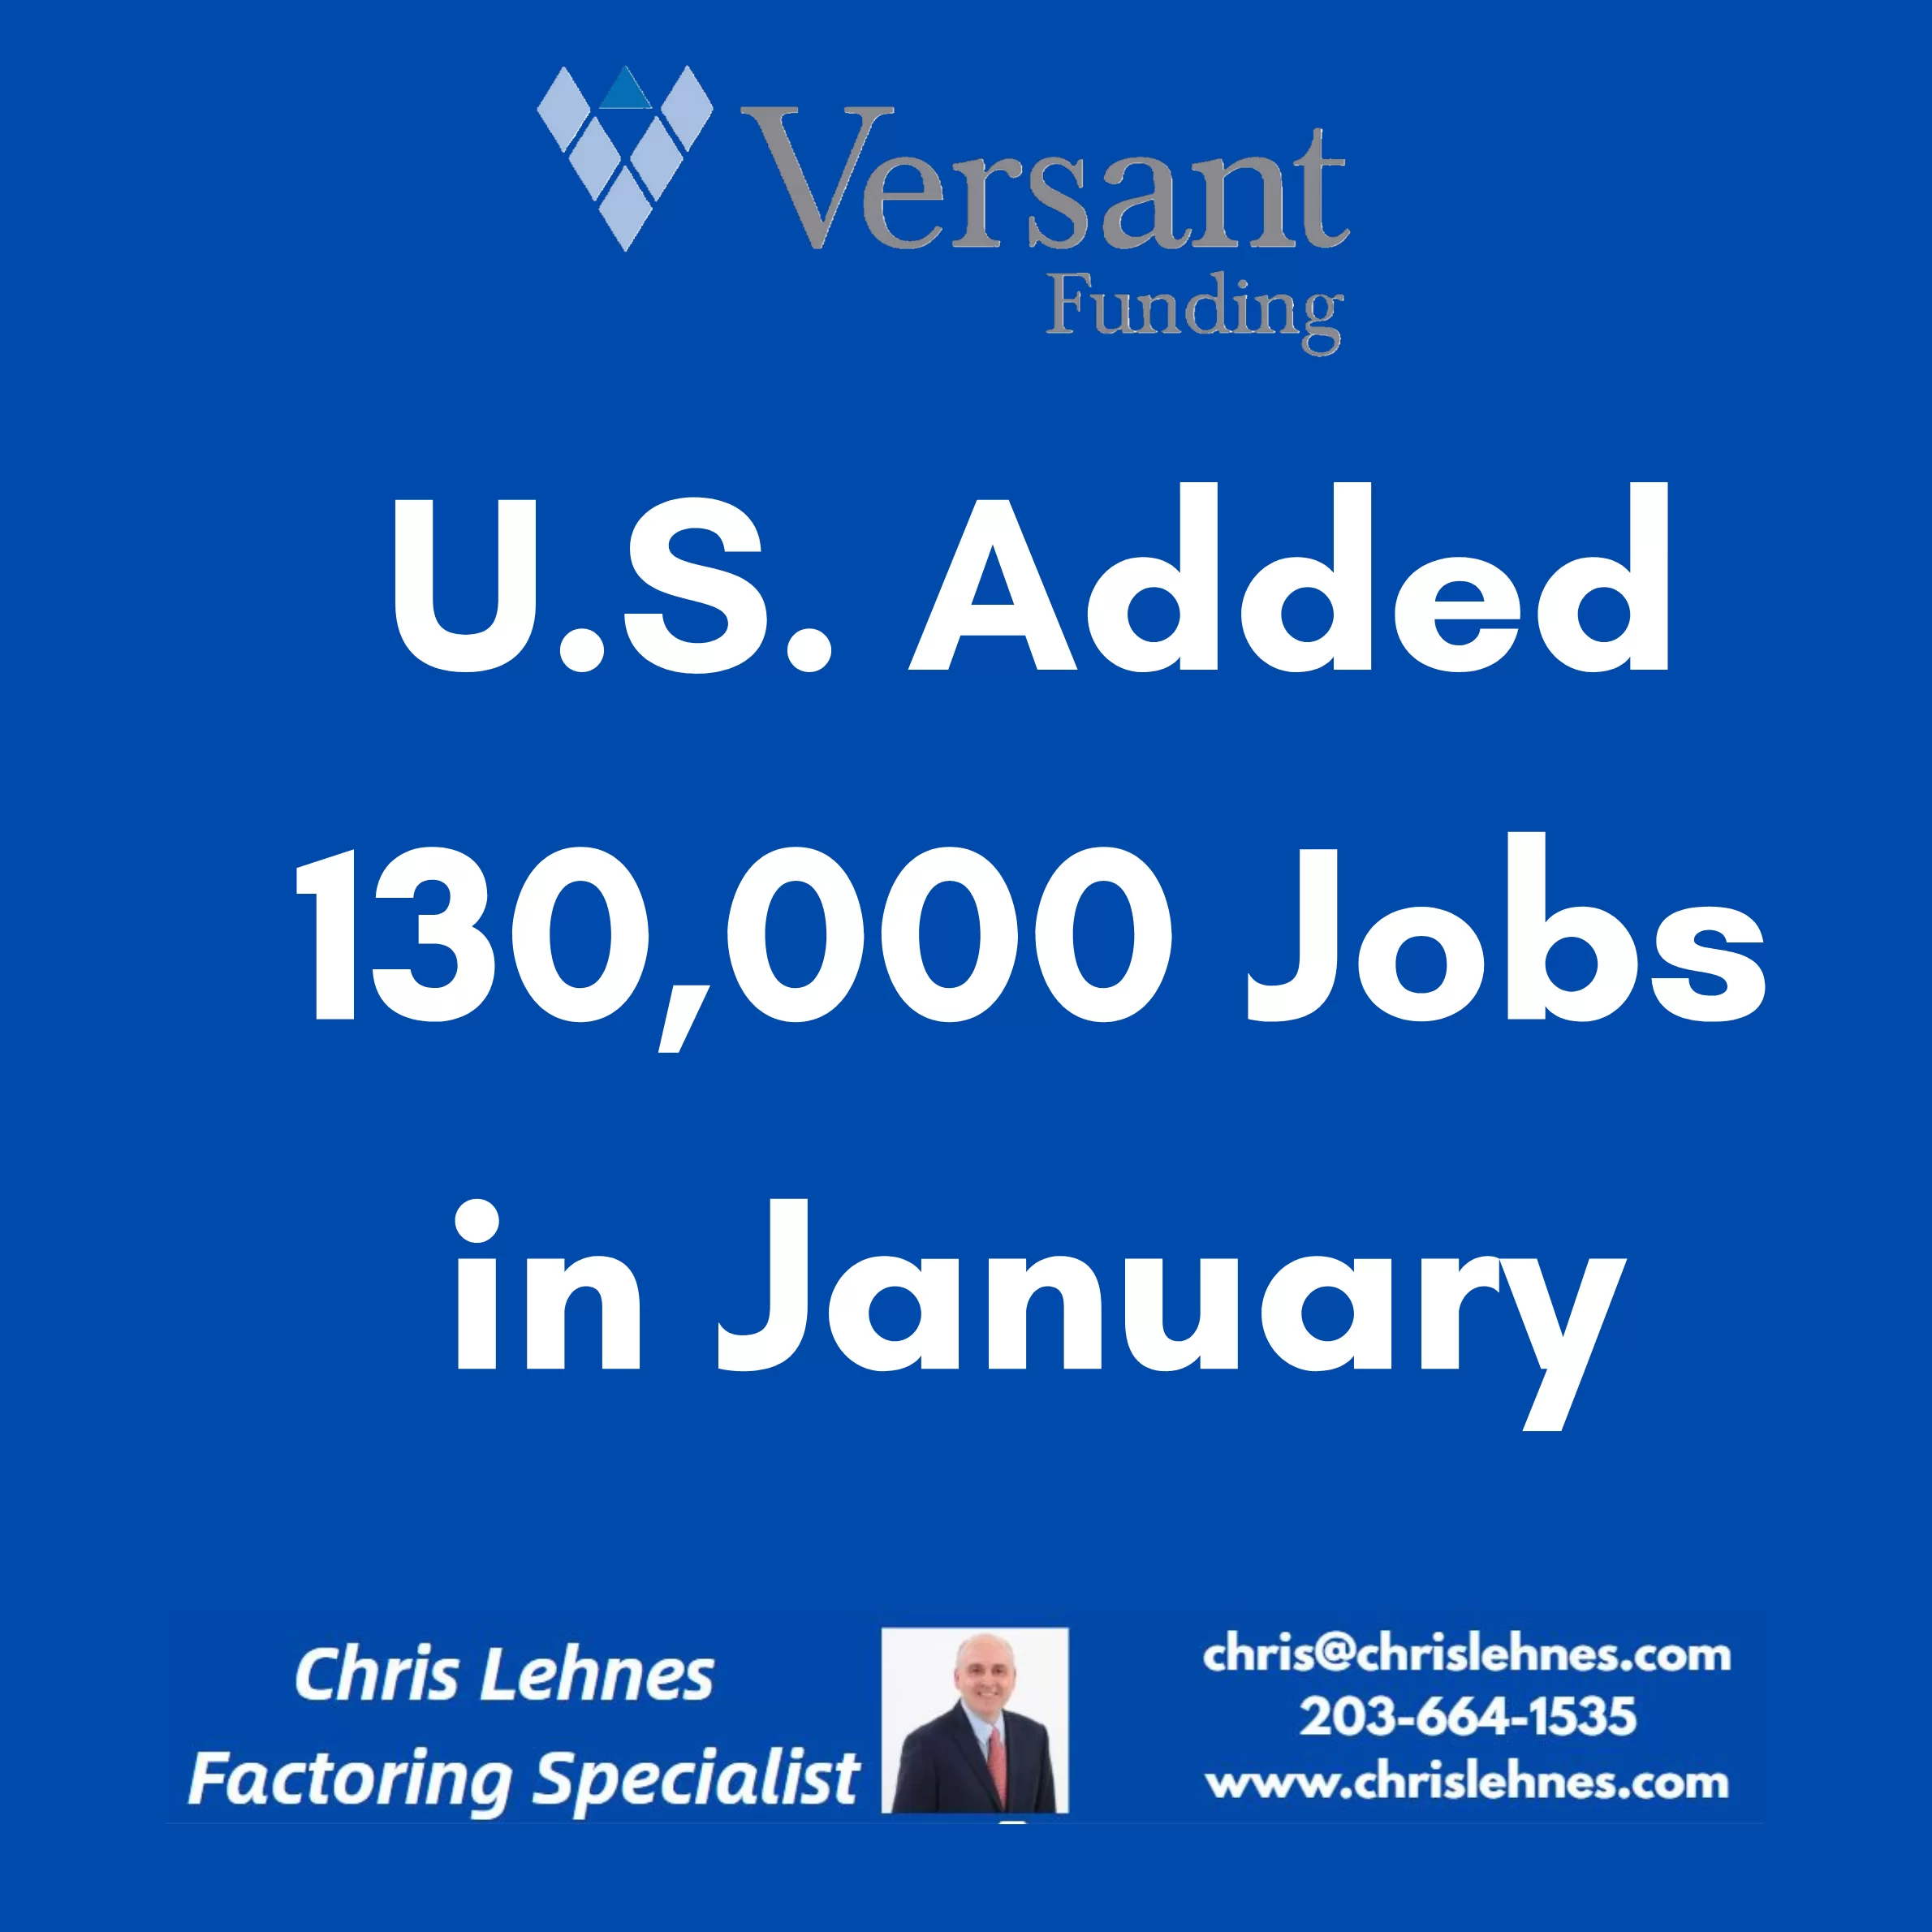
The U.S. labor market began 2026 with a surprising burst of energy, shaking off a sluggish 2025. According to the latest data from the Bureau of Labor Statistics (BLS) released on February 11, 2026, employers added 130,000 jobs in January—easily doubling December’s figures and blowing past economist expectations of roughly 70,000.
While the report was delayed by a week due to a brief federal government shutdown, the results suggest that the “hiring fatigue” seen late last year might be beginning to thaw.
The Numbers at a Glance
The January report offers a mix of resilience and necessary context for the year ahead:
Total Jobs Added: 130,000 (up from a revised 50,000 in December).
Unemployment Rate: Ticked down to 4.3% (from 4.4%).
Average Hourly Earnings: Rose by 0.4% in January, bringing the year-over-year increase to 3.7%.
Labor Force Participation: Remained steady at 62.5%.
Sector Winners and Losers
The growth wasn’t uniform across the board. In fact, a few key sectors carried the heavy lifting for the entire economy:
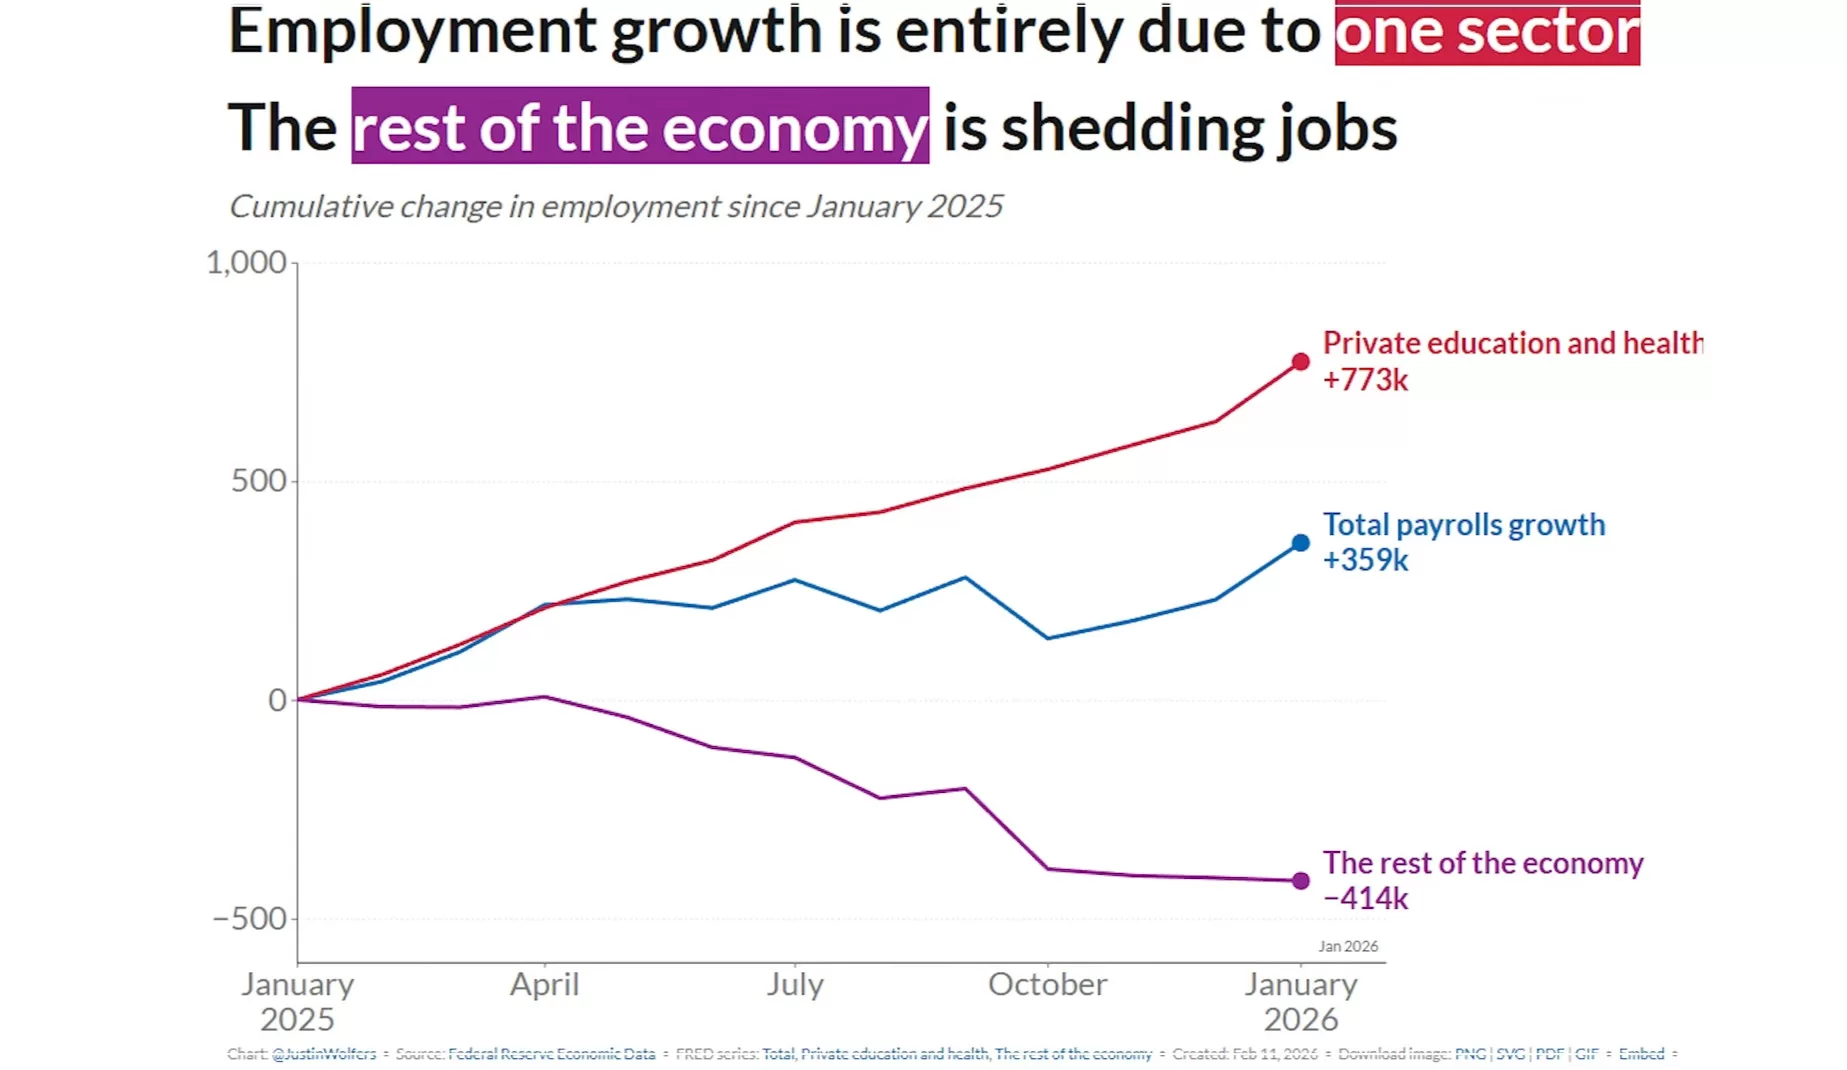
Healthcare & Social Assistance: This sector remains the titan of the U.S. job market, adding 124,000 jobs (82k in healthcare and 42k in social assistance).
Construction: Added a solid 33,000 jobs, largely driven by nonresidential specialty trade contractors.
The Tech & White-Collar Slump: Conversely, professional and business services and manufacturing continued to struggle, reflecting ongoing shifts in AI implementation and trade policy impacts.
Government: Federal employment saw a decline, partly a ripple effect of recent policy shifts and the temporary shutdown.
Why This Matters
After a tumultuous 2025—which was recently revised to show only 181,000 total jobs added for the entire year—this January figure is a massive sigh of relief. It suggests that while the economy isn’t sprinting, it’s found its footing.
“The January gains are a sign that the labor market is stabilizing,” says one economist. “However, the high concentration of growth in healthcare suggests a ‘one-legged stool’ economy that we need to watch closely.”
Looking Ahead
While 130,000 jobs is a “stronger footing,” the market remains complex. Layoffs in high-profile sectors like tech and transportation (notably Amazon and UPS) dominated January headlines, yet the aggregate data shows that other sectors are more than absorbing that displaced talent.
For job seekers, the message is clear: the opportunities are there, but they have shifted. Strategic hiring is the theme of 2026, with a high premium on specialized skills in healthcare, infrastructure, and adaptive technologies.
The January jobs report has effectively shifted the narrative for the Federal Reserve. While the 130,000 jobs added might seem modest by historical standards, it was a significant “beat” compared to expectations, and it has given the Fed a reason to tap the brakes on further interest rate cuts.
Here is how the latest data is influencing the Fed’s next move:
1. From “Easing” to “Holding”
Following three consecutive rate cuts in late 2025, the Federal Reserve held rates steady at its January 28, 2026 meeting, maintaining the federal funds rate at 3.5% to 3.75%. This jobs report reinforces that “pause.”
The Consensus: With the unemployment rate ticking down to 4.3% and job growth doubling December’s numbers, there is no longer an “emergency” need to stimulate the economy.
Market Sentiment: Before this report, some traders were betting on a March cut. Now, CME FedWatch tools show those odds have plummeted, with the consensus moving toward a “higher for longer” stance through at least the first half of the year.
2. Emerging Internal Division
The Fed is no longer acting in total unison. The January meeting saw a rare 10-2 vote, with two dissenting members actually pushing for another 25-basis-point cut due to lingering concerns about long-term hiring weakness.
The Hawks: Officials like Cleveland Fed President Beth Hammack and Dallas Fed President Lorie Logan have signaled that the Fed should “err on the side of patience,” arguing that current rates are “neutral”—neither helping nor hurting the economy.
The Doves: Those worried about the “one-legged stool” (growth coming only from healthcare) fear that without more cuts, sectors like tech and manufacturing will continue to bleed jobs.
3. The “Neutral Rate” Debate
Chair Jerome Powell recently noted that the economy is on a “firm footing” entering 2026. Analysts now believe the Fed is searching for the neutral rate—the sweet spot where inflation stays at 2% without triggering a recession.
Because average hourly earnings rose 0.4% in January (3.7% annually), the Fed is wary that cutting rates too soon could reignite inflation, especially with potential new trade tariffs on the horizon.
Key Dates to Watch
Event
Date
Significance
January CPI Report
Feb 13, 2026
Will confirm if the wage growth in the jobs report is driving up prices.
Fed “Beige Book”
Mar 4, 2026
Regional reports on how small businesses are actually feeling.
Next FOMC Meeting
Mar 17-18, 2026
The next formal window for a rate change decision.
For a small business owner, the January jobs report isn’t just about hiring statistics—it’s a leading indicator for the cost of your next loan or line of credit.
Following the stronger-than-expected labor data, the Federal Reserve has hit “pause” on interest rate cuts. For businesses at Versant Funding and across the U.S., this means a period of “stabilized high” borrowing costs. Here is what your business needs to know to navigate the financial landscape of early 2026.
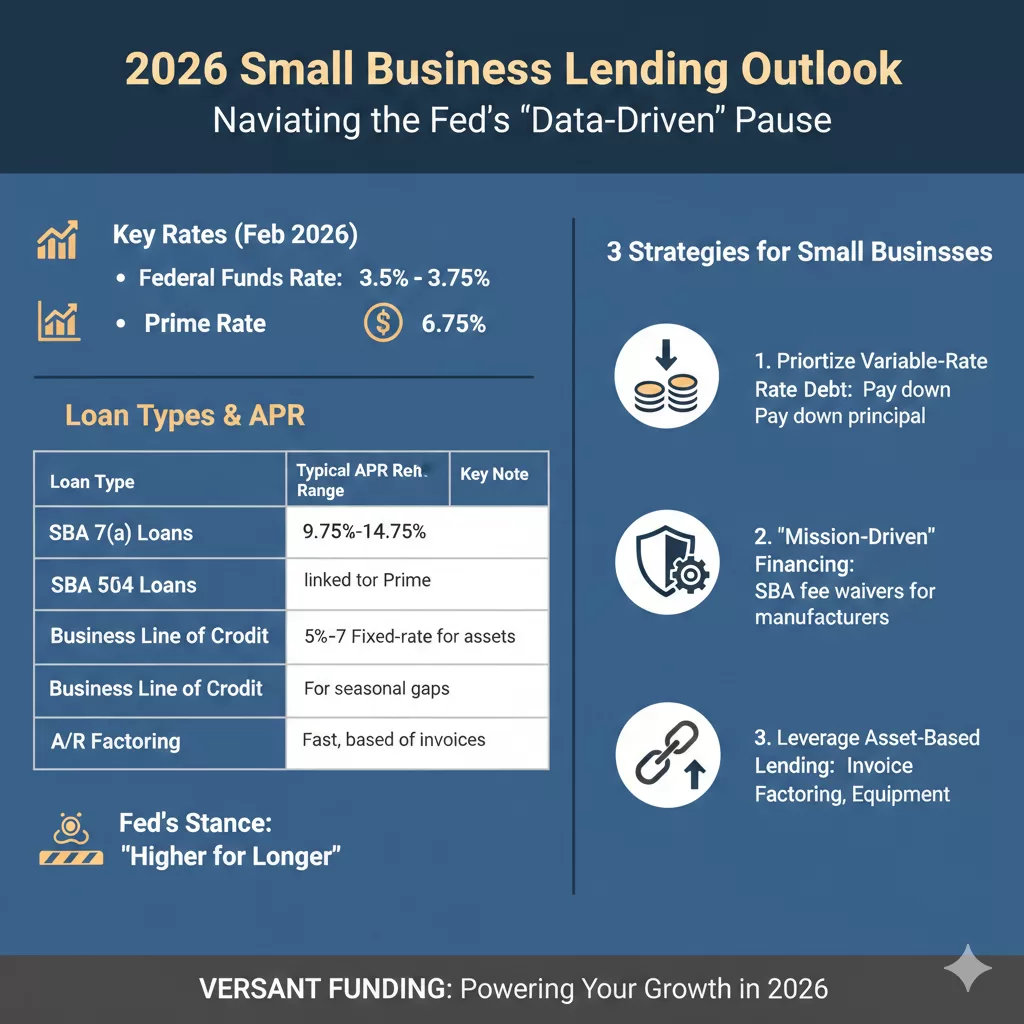
2026 Borrowing Outlook: The “Data-Driven” Pause
The Fed began 2026 by holding the federal funds rate steady at 3.5% to 3.75%. While the market had hoped for more aggressive easing, the surge of 130,000 new jobs in January has signaled to policymakers that the economy is not yet in need of more “cheap money.”
Current Lending Rates (As of February 2026)
Loan Type
Typical APR Range
Key Note
SBA 7(a) Loans
9.75% – 14.75%
Variable rates fluctuate with the Prime Rate (currently 6.75%).
SBA 504 Loans
5% – 7%
Fixed-rate; best for long-term real estate or equipment.
Business Lines of Credit
10% – 28%
Vital for seasonal inventory and payroll gaps.
Accounts Receivable Factoring
24% – 36%
High speed; based on invoice value rather than credit score.
Three Strategies for Small Businesses
With rates unlikely to drop significantly before the summer, owners should shift from “waiting for better rates” to “optimizing current cash flow.”
Prioritize Variable-Rate Debt: If you are carrying an SBA 7(a) loan or a variable line of credit, your payments will remain flat for now. Use this stability to pay down principal where possible, as the “higher for longer” stance means interest costs won’t be melting away anytime soon.
Look for “Mission-Driven” Financing: In 2026, the SBA is waiving guarantee fees for certain small manufacturers (NAICS 31-33). If your business fits this category, you could save thousands in upfront costs regardless of the interest rate.
Leverage Asset-Based Lending: If traditional bank term loans are too restrictive, consider Invoice Factoring or Equipment Financing. These options often focus more on the value of your assets (your unpaid invoices or machinery) than on the Fed’s baseline rates, providing more predictable access to capital during economic volatility.
The Bottom Line
The “stronger footing” of the U.S. labor market is a double-edged sword: it proves consumer demand is resilient, but it keeps the cost of capital elevated. For 2026, the most successful businesses will be those that prioritize liquidity and debt structure over simply chasing the lowest rate.
The results of recent surveys, most notably the Capital One Middle Market Strategic Investments report, have sent a ripple of confidence through the business community: 89% of middle-market companies are optimistic about their growth in 2026.
For those who track the “engine room” of the U.S. economy, this isn’t just a number—it’s a signal of a major strategic pivot. After years of playing defense against inflation and supply chain “whack-a-mole,” the middle market is moving back to offense.
Here is my take on why the “Mighty Middle” is feeling so bullish and what this means for the year ahead.
1. The “Big Beautiful Bill” Effect
A significant driver of this 89% figure is the One Big Beautiful Bill Act (OBBBA) passed in late 2025. Middle-market leaders aren’t just aware of the policy; they are already building it into their spreadsheets.
Tax Certainty: By codifying full expensing of capital expenditures and maintaining the 21% corporate tax rate, the bill has removed the “wait and see” hurdle that often stalls big investments.
Cash Flow: 59% of companies expect improved cash flow through these incentives, giving them the “dry powder” needed to expand.
2. AI: From “Hype” to “Help”
In 2024 and 2025, AI was a buzzword. In 2026, it’s a budget line item.
Operational Efficiency: 66% of middle-market businesses are prioritizing AI investment, not to replace humans, but to solve the persistent labor crunch.
ROI Focus: Unlike the “growth at all costs” tech era, middle-market firms are looking for AI to deliver specific returns—29% expect AI to be their highest-yielding investment this year.
3. Resilience Through “Alternate” Means
What I find most fascinating is the evolution of middle-market financing. With traditional bank lending remaining tight, 50% of these companies are now pursuing alternate financing, specifically private credit.
The Takeaway: Middle-market companies are no longer at the mercy of traditional interest rate cycles. They have diversified their “oxygen supply” (capital), allowing them to stay optimistic even when the Fed is being cautious.
4. The M&A “Spring”
After a multi-year slumber, deal-making is waking up. Nearly 44% of middle-market firms intend to pursue acquisitions in 2026. This suggests that the optimism isn’t just about internal growth; it’s about consolidation and picking up smaller players who may not have the scale to handle 2026’s regulatory and technological demands.
The Bottom Line: Execution is the New Strategy
The 89% optimism rate doesn’t mean the road is easy. Leaders are still citing inflation (97%) and tariffs as major headaches. However, the difference in 2026 is preparedness.
Middle-market companies have spent the last two years “stress-testing” their models. They are leaner, more tech-forward, and more agile than they were pre-2020. If 89% of them believe they can win this year, the rest of the market should probably pay attention.
The “Mighty Middle” is playing offense in 2026. 🚀
The numbers are in, and they are striking: 89% of middle-market companies are officially optimistic about their growth this year.
After years of navigating the “whack-a-mole” challenges of inflation and supply chain disruptions, we are seeing a massive strategic pivot. Middle-market leaders aren’t just surviving; they are scaling.
Why the surge in confidence?
The OBBBA Effect: Tax certainty and full expensing are providing the “dry powder” needed for major capital investments.
AI Integration: We’ve moved past the hype. Companies are now budgeting for AI to solve real-world labor shortages and drive operational efficiency.
Alternative Financing: With traditional bank lending remaining tight, the shift toward private credit and alternative capital sources is keeping growth on track.
M&A Resurgence: Nearly 44% of these firms are looking to acquire, signaling a year of consolidation and expansion.
The bottom line? These companies have “stress-tested” their models for two years. They are leaner, tech-forward, and ready to win.
Is the Middle Market the new economic bellwether for 2026? 📈
The data is hard to ignore: 89% of middle-market firms are entering 2026 with high optimism. This isn’t just “wishful thinking”—it’s a calculated response to a shifting fiscal and technological landscape.
Here are the four pillars driving this confidence:
Fiscal tailwinds: The One Big Beautiful Bill Act (OBBBA) has finally provided the tax certainty and full-expensing incentives required to move “wait-and-see” capital into active deployments.
Maturity in AI adoption: We have moved beyond the “hype cycle.” 66% of mid-cap leaders are now prioritizing AI as a tool for operational leverage, specifically targeting persistent labor bottlenecks.
The Rise of Alternative Credit: As traditional bank lending remains constrained, the pivot toward private credit and specialized liquidity solutions has decoupled middle-market growth from traditional interest rate volatility.
Strategic Consolidation: With 44% of firms pursuing M&A, we are entering a period of significant market “up-tiering.”
The “Mighty Middle” has spent the last 24 months stress-testing their balance sheets. In 2026, they aren’t just defending their position—they are expanding it.
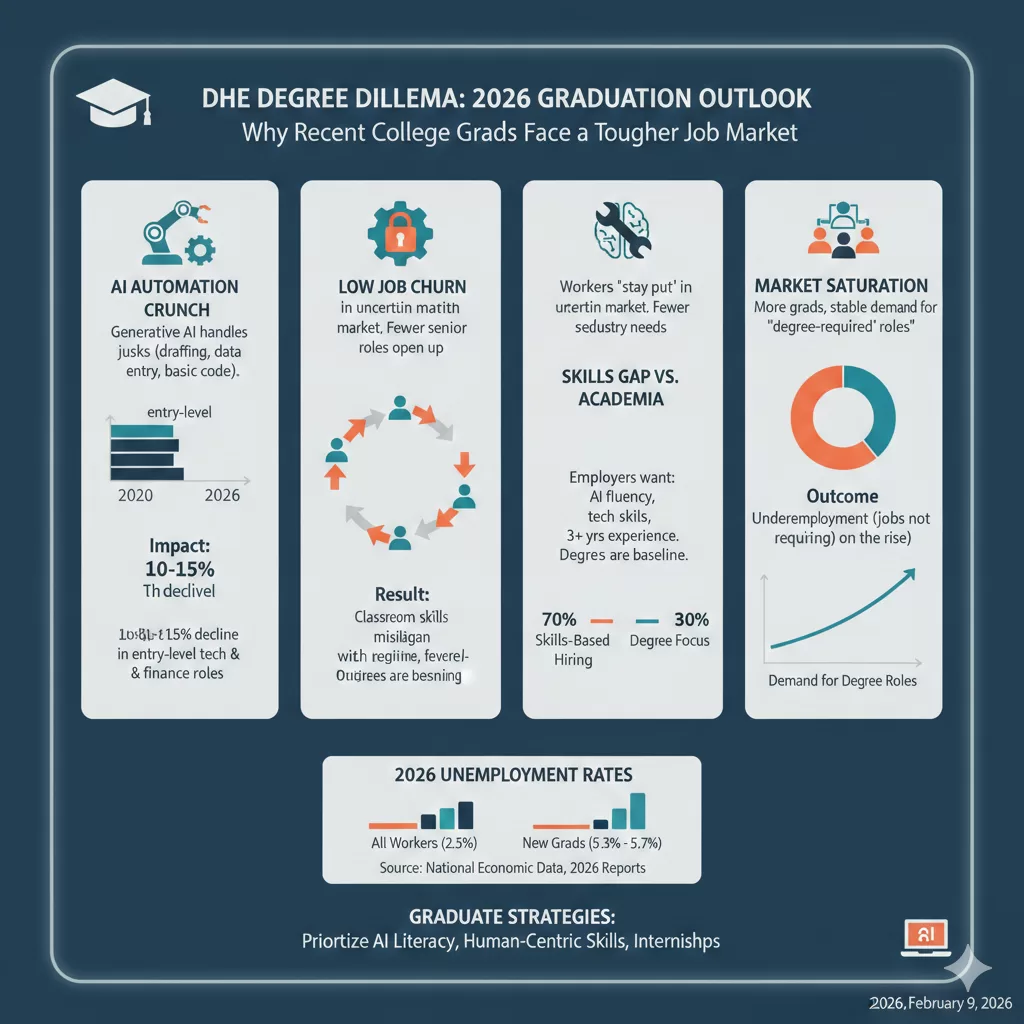
For decades, the path to employment followed a predictable script: graduate high school, earn a four-year degree, and step into a stable career. But for the Class of 2026 and other recent grads, that script has been heavily revised.
While the national unemployment rate remains relatively stable, a closer look reveals a “white-collar friction” that is hitting young graduates particularly hard. Recent data suggests that unemployment for workers aged 22–27 is significantly higher than for the general population, with some reports showing rates as high as 5.3% to 5.7% for new degree holders compared to just 2.5% for their more experienced counterparts.
Why is the “college advantage” seemingly cooling off? Here are the primary factors reshaping the entry-level landscape.
1. The “Bottom Rung” is Being Automated
Perhaps the most significant shift in 2026 is the impact of Generative AI. Historically, junior roles involved “intellectually mundane” tasks: drafting reports, organizing data, or basic coding. These were the “training wheels” of a career.
Today, AI agents handle these tasks with 90% accuracy in seconds.
The Result: Companies are becoming more “top-heavy.” They still need experienced managers to oversee AI, but they need fewer junior employees to do the legwork.
The Crunch: Entry-level hiring has seen double-digit declines in sectors like tech and finance, as firms use AI to boost productivity without expanding their headcount.
2. The Great “Stay Put” (Low Churn)
In a healthy economy, people switch jobs, creating “openings” at the bottom for new talent. In 2026, we are seeing a collapse in voluntary job switching.
“Workers are holding onto their roles because the market feels risky; as a result, the natural ‘churn’ that usually pulls recent grads into the workforce has stalled.”
When mid-level employees don’t move up or out, the entry-level pipeline remains clogged.
3. The Rising “Skills Gap” vs. Academic Focus
There is a growing disconnect between what is taught in the classroom and what is required in a modern office.
The Degree is the Baseline, Not the Finish Line: Employers are shifting toward skills-based hiring. According to NACE, 70% of employers now prioritize specific technical skills and AI fluency over the prestige of the degree itself.
Experience Over Everything: Job postings that once asked for 0–2 years of experience are increasingly demanding 3+ years or specific internships. For a recent grad, this creates the classic paradox: You can’t get the job without experience, but you can’t get experience without the job.
4. Market Saturation
We are currently seeing the result of “education-neutral” growth. The supply of college graduates has increased steadily, but demand for roles that specifically require a degree has leveled off. This has led to a rise in underemployment, where graduates find themselves in roles that don’t actually require their hard-earned credentials.
What Can Grads Do?
The market is tougher, but it isn’t closed. To stand out in the current environment, graduates must:
Prioritize AI Literacy: It’s no longer a “plus”; it’s a requirement. Show how you use AI to work faster and smarter.
Focus on “Human-Centric” Skills: Emphasize critical thinking, complex problem solving, and emotional intelligence—things AI still struggles to replicate.
Treat Internships as Essential: In 2026, an internship is often the only way to bypass the “3 years of experience” requirement.
The Sluggish Job Growth of the U.S. labor market is currently sending mixed signals that lean toward the “rough” side. After months of subtle hiring freezes and quiet cutbacks, the dam has seemingly broken, leading to a wave of high-profile layoff announcements that have left both job seekers and investors on edge.
From “Quiet Quitting” to “Quiet Hiring”… to Just “Quiet”
Last year, the narrative was dominated by “labor hoarding”—companies holding onto staff despite economic uncertainty. That trend has officially cooled. What we are seeing now is a three-phase retraction:
The Big Freeze: Before the layoffs began, many firms implemented unannounced hiring freezes. If you noticed your applications disappearing into a “black hole” in Q4, you weren’t imagining it.
The Strategic Cut: We’ve moved past the “growth at all costs” mindset of the early 2020s. Companies are now optimizing for efficiency, which often means trimming middle management and non-core departments.
Market Rattling: These moves aren’t just affecting workers; they’re making Wall Street twitchy. While layoffs sometimes boost stock prices in the short term by promising better margins, a systemic pullback in hiring signals a lack of confidence in broader consumer spending.
Why is this happening now?
It’s a perfect storm of economic factors. Interest rates remain a point of contention, and the “higher for longer” reality has finally forced CFOs to tighten the belt. Additionally, the rapid integration of AI and automation is no longer a futuristic concept—it’s actively reshaping how companies budget for human capital.
Key Takeaway: The power dynamic has shifted. We are no longer in the “Great Resignation” era where candidates held all the cards. We are in an “Employer’s Market” characterized by high competition and rigorous vetting.
Survival Tips for the 2026 Job Seeker
If you’re currently in the trenches or worried about your role, “rough” doesn’t have to mean “impossible.” Here is how to adapt:
Focus on ‘Recession-Proof’ Skills: Lean into roles that directly impact revenue or operational efficiency.
Networking is the New Resume: With hiring portals frozen or flooded, a warm introduction is often the only way to bypass the digital gatekeepers.
Audit Your Tech Literacy: Companies are hiring for roles that can leverage new tools to do more with less. Show that you are that person.
The January chill in the job market is a sobering reminder that economic cycles are inevitable. While the headlines look daunting, history shows that these periods of contraction often lead to leaner, more resilient industries. The goal for now? Stay agile, stay informed, and keep your pulse on the shifting landscape.
Every year, we’re told that January is the season for “new beginnings.” But for many of my colleagues and friends, 2026 started with a calendar invite that no one wants to see.
With over 100,000 layoffs announced just last month, it’s easy to feel like the ground is shifting beneath us. It’s frustrating to see companies freeze hiring right when talented people are looking for their next chapter.
What I’ve learned during market shifts like this:
Your job is what you do, not who you are. Resilience starts with separating your self-worth from a corporate headcount.
The “Hidden Market” is real. When the portals freeze, the human network thaws. Most of the hiring right now is happening through referrals and back-channel conversations.
Skill-stacking is the best defense. The folks I see landing roles right now are the ones who didn’t just wait—they spent the “freeze” learning how to leverage AI to make themselves a “team of one.”
If you were part of the January cuts, take a breath. The market is rough, but you are capable.
If I can help you with a referral, a resume check, or just a word of encouragement, please reach out. Let’s help each other get through the “January Chill.” ☕️👇
January just delivered a wake-up call to the U.S. workforce. Here’s the “lowdown” on the slowdown:
108k+: Layoffs announced in the last 31 days (the highest since ’09).
Record Lows: Hiring plans have hit a historic slump for Q1.
The Shift: Efficiency and AI-proficiency are officially the new “must-haves.”
The bottom line? The “Great Resignation” is a memory. We are now in the “Great Recalibration.”
If you’re hiring, post your roles in the comments. If you’re looking, tell us one “efficiency win” you’ve had recently. Let’s turn this feed into a resource.
Contains information related to marketing campaigns of the user. These are shared with Google AdWords / Google Ads when the Google Ads and Google Analytics accounts are linked together.
90 days
__utma
ID used to identify users and sessions
2 years after last activity
__utmt
Used to monitor number of Google Analytics server requests
10 minutes
__utmb
Used to distinguish new sessions and visits. This cookie is set when the GA.js javascript library is loaded and there is no existing __utmb cookie. The cookie is updated every time data is sent to the Google Analytics server.
30 minutes after last activity
__utmc
Used only with old Urchin versions of Google Analytics and not with GA.js. Was used to distinguish between new sessions and visits at the end of a session.
End of session (browser)
__utmz
Contains information about the traffic source or campaign that directed user to the website. The cookie is set when the GA.js javascript is loaded and updated when data is sent to the Google Anaytics server
6 months after last activity
__utmv
Contains custom information set by the web developer via the _setCustomVar method in Google Analytics. This cookie is updated every time new data is sent to the Google Analytics server.
2 years after last activity
__utmx
Used to determine whether a user is included in an A / B or Multivariate test.
18 months
_ga
ID used to identify users
2 years
_gali
Used by Google Analytics to determine which links on a page are being clicked
30 seconds
_ga_
ID used to identify users
2 years
_gid
ID used to identify users for 24 hours after last activity
24 hours
_gat
Used to monitor number of Google Analytics server requests when using Google Tag Manager