Factoring: Use AR To Get Cash for a Successful Summer

Summer acts as a brutal stress test for business cash flow. For seasonal industries, it’s a chaotic sprint that requires immediate cash to hire seasonal staff and buy inventory. For B2B service companies, summer often brings the dreaded “vacation slump”—decision-makers are out of the office, and Net-30 invoices suddenly stretch to Net-60 or Net-90. Consider Factoring.

In both scenarios, having your capital trapped in unpaid Accounts Receivable (AR) is a massive liability. If you have $100,000 sitting in your AR aging report but can’t make a $10,000 payroll on Friday, your business is technically growing but functionally starving.

This is where invoice factoring becomes a critical tool to unlock your cash flow and keep your summer operations running smoothly.

What is AR Factoring?

Invoice factoring is not a loan; it is the sale of an asset. You are selling your outstanding B2B invoices to a third-party company (the factor) at a discount in exchange for immediate cash.

Here is how the standard mechanism works:

  1. The Advance: You sell a verified invoice to the factor. They advance you the bulk of the invoice value immediately—typically 75% to 85%—usually within 24 to 48 hours.
  2. The Collection: Your customer pays the factor directly according to your standard terms (e.g., 30 or 60 days).
  3. The Rebate: Once the customer pays the invoice in full, the factor releases the remaining 15% to 25% to you, minus their factoring fee (which generally ranges from 1.5% to 2.5% per month of the invoice value, depending on how long it takes the customer to pay and their creditworthiness).

How Factoring Solves Summer Cash Flow Bottlenecks

Relying on AR factoring shifts your business from a defensive posture (waiting for checks to arrive) to an offensive one.

1. Funding the Summer Spike

If your business peaks between Memorial Day and Labor Day, you have to spend money before you make it. You need to repair equipment, purchase bulk materials, and onboard temporary employees. Factoring allows you to leverage the work you completed in May to fund the massive projects you are taking on in June, without waiting for the bank to approve a traditional line of credit.

2. Surviving the B2B Payment Slowdown

When your clients’ accounts payable departments go on summer vacation, your invoices sit on desks. Factoring insulates your business from your clients’ slow payment habits. By advancing the cash, the factor absorbs the wait time. You get the working capital you need to cover fixed overhead costs—like rent, software subscriptions, and core payroll—regardless of whether your client takes 30 or 75 days to pay.

3. Taking Advantage of Supplier Discounts

Suppliers often offer early-pay discounts (e.g., a “2/10 Net 30” deal, meaning a 2% discount if paid within 10 days). If your cash is tied up in AR, you miss these savings. Factoring gives you the liquidity to pay your suppliers upfront. Often, the supplier discount you secure by having cash on hand will offset a significant portion of the factoring fee.

Strategic Considerations Before You Factor

While factoring is highly accessible—because factors care more about your customers’ credit scores than your own—it requires strategic management:

  • Mind your profit margins: Factoring makes the most sense for businesses with healthy margins (typically 15% or higher). If you operate on razor-thin margins, giving up 2% to 4% of your gross revenue to a factor can wipe out your profitability.
  • Recourse vs. Non-Recourse: Understand the terms you are signing. In recourse factoring (the most common and affordable type), if your customer ultimately defaults and never pays the invoice, you must buy the invoice back from the factor. In non-recourse factoring, the factor absorbs the loss if the customer goes bankrupt, but you will pay higher fees for that protection.

If unpaid invoices are the only thing standing between you and a highly profitable summer season, AR factoring is one of the fastest ways to turn your ledger into liquid capital. By treating your receivables as immediate cash, you can stop acting as a free bank for your clients and start investing in your own growth.

Contact Factoring Specialist, Chris Lehnes

How 4 Key Commodities Drive the Housing Market into an Affordability Crisis

Commodity Prices:

If you’ve been watching the housing market lately, you’re probably feeling a mix of exhaustion and sticker shock. It’s completely understandable to feel frustrated when home prices seem disconnected from reality. But while we often blame interest rates, zoning laws, or real estate investors for the high cost of housing, there is a hidden, grounded reality driving these numbers: the cost of raw materials. A house is essentially a massive assembly of global commodities. When the prices of the raw materials needed to build and transport a home spike, those costs are passed directly onto the buyer, limiting new inventory and driving up the prices of existing homes. https://www.hud.gov

Let’s pull back the drywall and look at how four foundational commodities—copper, lumber, aluminum, and diesel—dictate the reality of the housing market.

1. Lumber: The Skeleton of the Home

When you think of home construction, lumber is usually the first thing that comes to mind. It forms the literal skeleton of most single-family houses.

  • Where it’s used: Framing, flooring, roof trusses, cabinetry, and doors.
  • The Market Impact: The average single-family home requires roughly 16,000 board feet of lumber. When lumber prices skyrocket (as we saw during pandemic-era supply chain crunches), it can add tens of thousands of dollars to the base cost of a newly built home.
  • The Ripple Effect: When building a new home becomes too expensive, builders slow down construction. This chokes off new housing inventory, forcing buyers into the existing home market and bidding up prices across the board.

2. Copper: The Nervous System

You rarely see it once the house is finished, but copper is what brings a home to life. It is the gold standard for conductivity and durability.

  • Where it’s used: Electrical wiring, plumbing pipes, and HVAC systems. A typical single-family home contains about 400 pounds of copper.
  • The Market Impact: Copper is heavily dependent on global macroeconomic trends. Because it is crucial for electric vehicles and renewable energy infrastructure, the global demand for copper is surging. As builders compete with the tech and auto industries for the same metal, the cost to wire and plumb a new home steadily climbs.

3. Aluminum: The Armor

Lightweight, strong, and resistant to corrosion, aluminum protects the home from the elements while keeping it energy-efficient.

  • Where it’s used: Window frames, exterior siding, gutters, roofing, and garage doors.
  • The Market Impact: Producing aluminum is an incredibly energy-intensive process. When global energy prices rise, the cost to smelt aluminum rises with them. If aluminum becomes too expensive, builders are forced to use cheaper, less durable alternatives, or pass the premium directly to the buyer, raising the baseline cost of weatherproofing and finishing a home.

4. Diesel: The Hidden Multiplier

Diesel doesn’t end up inside the house, but the house cannot exist without it. It is the lifeblood of the construction and logistics industries.

  • Where it’s used: Fueling the logging trucks that carry the timber, the cargo ships that transport the copper, the 18-wheelers that deliver the aluminum, and the bulldozers, excavators, and cranes that actually build the neighborhood.
  • The Market Impact: Diesel acts as a cost multiplier. If the price of diesel jumps, the cost of every single other material increases because it costs more to get those materials to the job site. High diesel prices also squeeze contractors’ profit margins, meaning they have to charge more for their labor and equipment time.

The Bottom Line

The housing market doesn’t exist in a vacuum. It is deeply tied to the physical world and the global supply chain.

When you see headlines about overseas mining strikes, lumber tariffs, or fluctuations in oil markets, you are actually looking at leading indicators for tomorrow’s housing market. A spike in these four commodities makes new homes more expensive to build, which slows down development, restricts housing supply, and ultimately makes it harder for the average person to afford a home. Understanding these hidden drivers doesn’t instantly make buying a house easier, but it does demystify why the numbers on the final price tag are what they are.

Contact Factoring Specialist, Chris Lehnes

https://www.chrislehnes.com/wp-content/uploads/2026/05/Animate_this_image.mp4

Memorial Day – History and Origins – Why we celebrate

From Decoration Day to a National Holiday: The True History of Memorial Day

For many Americans, Memorial Day marks the unofficial start of summer—a three-day weekend filled with barbecues, pool openings, and mattress sales. But beneath the modern commercialism lies a profound and somber history rooted in the aftermath of the deadliest conflict in U.S. history.

https://www.chrislehnes.com/wp-content/uploads/2026/05/Memorial-day-1.mp4

Originally established to honor the approximately 620,000 soldiers who died during the Civil War, Memorial Day began as a grassroots movement of communal grief. Here is the story of how local tributes to fallen soldiers evolved into a national day of remembrance.

The Earliest Observances

Before there was an official national holiday, there were local communities grappling with unprecedented loss. The Civil War claimed roughly 2% of the U.S. population at the time. With the sheer volume of casualties, communities on both sides of the conflict began holding springtime tributes to honor the dead, decorating their graves with flowers.

Several towns claim the title of the “birthplace” of Memorial Day, including Boalsburg, Pennsylvania, and Columbus, Mississippi. In 1966, the federal government officially recognized Waterloo, New York, as the birthplace because the town hosted a formal, annual, community-wide event starting on May 5, 1866, where businesses closed so residents could decorate soldiers’ graves.

However, historical records point to an even earlier, poignant observance. On May 1, 1865, in Charleston, South Carolina, a group of formerly enslaved African Americans organized a massive tribute. They gathered at a former racetrack that had been used as a Confederate prison camp to properly rebury and honor 257 Union soldiers who had died there. A procession of 10,000 people, led by 3,000 Black schoolchildren carrying roses and singing patriotic songs, marched to the site to decorate the graves—one of the earliest documented Memorial Day observances.

General Logan and “Decoration Day”

The push for a unified, national day of remembrance came in 1868. On May 5 of that year, Major General John A. Logan, the head of the Grand Army of the Republic (an organization of Union veterans), issued General Order No. 11.

He designated May 30, 1868, as a day for “strewing with flowers, or otherwise decorating the graves of comrades who died in defense of their country.” Logan chose May 30 specifically because it was not the anniversary of any particular battle, and flowers would be in full bloom across the country.

The day became widely known as Decoration Day. On that first official observance, General James Garfield gave a speech at Arlington National Cemetery, and 5,000 participants helped decorate the graves of 20,000 Union and Confederate soldiers buried there.

By 1890, every Northern state had made Decoration Day an official state holiday. Many Southern states, however, chose to honor their dead on separate dates until after World War I.

The Shift to Memorial Day

For decades, Decoration Day strictly honored those lost in the Civil War. That changed in the aftermath of World War I. The staggering casualties of the Great War led to the holiday’s expansion to commemorate American military personnel who died in all wars.

As the scope of the holiday expanded, the name gradually shifted. Though people began using the term “Memorial Day” in the 1880s, it wasn’t until after World War II that the new name became more common than Decoration Day.

https://www.chrislehnes.com/wp-content/uploads/2026/05/Memorial-day.mp4

The holiday’s modern schedule was established in 1968. Congress passed the Uniform Monday Holiday Act, which moved Memorial Day from its traditional May 30 date to the last Monday in May to create a three-day weekend for federal employees. The law went into effect, and Memorial Day officially became a federal holiday in 1971.

Honoring the Day Now

Today, the core traditions of Memorial Day remain alive at national cemeteries across the country, where soldiers and volunteers place small American flags at each gravestone.

To ensure the true meaning of the day isn’t lost in the shuffle of long-weekend celebrations, Congress passed the National Moment of Remembrance Act in 2000. It asks all Americans to pause for a moment of silence at 3:00 PM local time on Memorial Day to reflect on the men and women who made the ultimate sacrifice for their country.

Contact Factoring Specialist Chris Lehnes

The Pain at the Pump: Inflation Hits 3.8% in April

Inflation hits 3.8%

If your last trip to the gas station felt like a hit to your wallet, you aren’t alone. The latest Consumer Price Index (CPI) report is out, and the numbers confirm what we’ve all been feeling: U.S. inflation jumped to 3.8% in April, up from 3.3% in March.

This represents the highest inflation rate since 2023, and it marks a significant detour from the “path to 2%” that the Federal Reserve has been aiming for. While price increases have cooled in some sectors, the energy market is currently the primary engine driving these numbers higher.


Gasoline: The Primary Culprit

The standout figure in April’s report is the cost of energy. National average gas prices have surged to approximately $4.50 per gallon, a staggering jump from the sub-$3.00 levels seen just a few months ago in February.

This spike isn’t just a random market fluctuation. It is being driven heavily by geopolitical instability, specifically the ongoing conflict with Iran. The closure of the Strait of Hormuz—a vital artery for global oil supply—has sent shockwaves through the market. When a fifth of the world’s oil supply is threatened, the impact is immediate and felt directly at the local pump.

The “Trickle-Down” of High Energy Costs

High gas prices do more than just make commuting more expensive. They create a “cost-of-living” domino effect:

  • Transportation & Logistics: Shipping companies and airlines are facing massive fuel surcharges, which eventually get passed down to the consumer.
  • Food Prices: Agriculture and grocery distribution are energy-intensive. As diesel and gas prices rise, expect your grocery bill to remain stubbornly high.
  • Manufacturing: Factories that rely on heavy energy consumption are seeing their margins squeezed, leading to higher prices for finished goods.

What This Means for Interest Rates

For months, the big question in the financial world has been: When will the Fed cut interest rates?

This 3.8% reading makes that answer much more complicated. Outgoing Fed Chair Jerome Powell and incoming Chair Kevin Warsh are facing a “higher-for-longer” reality. Typically, the Fed raises interest rates to cool a hot economy and lower inflation. With inflation trending upward again, the prospect of rate cuts in 2026 is fading, and some economists are even whispering about the possibility of another hike if the energy crisis doesn’t stabilize.

The Bottom Line

The April inflation report is a sobering reminder of how interconnected our local economy is with global events. While the U.S. economy remains resilient in many areas, the “gasoline tax” created by geopolitical tension is a heavy burden for the average household.

For now, the focus remains on the Middle East. Until energy supply stabilizes, the Fed—and our bank accounts—will likely be in a defensive crouch.


What are you doing to offset rising costs? Are you changing your summer travel plans or looking into more fuel-efficient alternatives? Let us know in the comments below.

Consumer Price Index Summary – May 12, 2026

Co

Higher Gas Prices Are Invading the Produce Aisle

Higher gas prices aren’t just a headache at the pump anymore. They are quietly but surely making their way into your local grocery store, specifically hitting the produce aisle.

While it might seem like a stretch to connect the cost of filling up your sedan to the price of a head of lettuce, the two are more intertwined than most realize. Here’s a breakdown of why your salads are getting more expensive and what it means for your weekly grocery bill.


1. The Logistics of Freshness

The most direct link between fuel and food is transportation. Unlike canned goods or grains, which have a long shelf life and can be moved via slower, more fuel-efficient methods like rail, fresh produce is a race against the clock.

  • Trucking Dependence: Most of our fruits and vegetables are transported by refrigerated trucks. When diesel and gasoline prices spike, freight surcharges follow suit.
  • The Distance Factor: In the U.S., the average piece of produce travels roughly 1,500 miles from farm to plate. Every mile costs more when fuel is at a premium.

2. On the Farm: More Than Just Tractors

Farmers feel the pinch long before the food is loaded onto a truck. Modern agriculture is incredibly energy-intensive.

  • Equipment Fuel: Tractors, harvesters, and irrigation pumps almost all run on diesel or electricity derived from fossil fuels.
  • Fertilizer Costs: This is the “hidden” fuel cost. Many synthetic fertilizers are nitrogen-based, produced using natural gas as a primary feedstock. When energy prices rise globally, the cost of nourishing the soil skyrockets.

3. The “Seeping” Effect: Why Now?

You might notice that gas prices jump overnight, but produce prices take a few weeks to catch up. This is known as “price lag.” Retailers often try to absorb small fluctuations to keep customers happy, but when high fuel costs persist, those margins disappear.

According to recent 2026 consumer surveys, nearly 60% of shoppers are now noticing that their essential spending—like dairy and produce—is being squeezed by the energy market.


4. How to Protect Your Budget

If you’re tired of seeing your grocery total climb, here are a few ways to mitigate the “gas-to-produce” pipeline:

  • Shop Seasonally: Out-of-season fruit often has to be flown in or shipped from the southern hemisphere, drastically increasing the fuel cost per item.
  • Support Local Farmers Markets: Reducing the miles your food travels is the most effective way to cut out the transportation middleman.
  • Frozen vs. Fresh: Flash-frozen vegetables are often processed near the farm and shipped in bulk, which can be more cost-effective during fuel spikes without sacrificing nutrition.

The Bottom Line: As long as our food system relies on long-distance logistics and energy-heavy farming, the “check engine” light on your car will continue to be a warning sign for the price of your groceries.

Contact Factoring Specialist, Chris Lehnes

AI Is Distorting Everything About the US Economy

The Invisible Hand is Getting a Digital Upgrade (and a Glitch)

For decades, the US economy felt like a predictable, if sometimes temperamental, machine. We looked at the S&P 500, labor participation, and GDP, and we generally knew where we stood. But lately, with AI the gauges are spinning.

As we move through 2026, it’s becoming clear that Artificial Intelligence isn’t just another “sector” or a “tailwind.” It has become a massive, invisible force field distorting the very metrics we use to define economic health. From a soaring stock market that masks a stagnant middle class to a trade deficit driven by chips rather than cars, the “AI Distortion” is the new reality.


1. The Tale of Two Economies: AI vs. Everything Else

If you look at the surface-level GDP growth, things look great. But peel back the layers, and you’ll find a massive divergence.

Recent estimates suggest the “AI economy”—driven by massive capital expenditure from tech giants—is growing at a blistering pace of over 30%. Meanwhile, the rest of the traditional economy is barely treading water. We are seeing a “Hurricane-strength” weather system where a handful of companies (the “Magnificent 7” and their suppliers) are responsible for nearly all the growth, while sectors like housing, transportation, and traditional manufacturing face headwinds.

Key Stat: Morgan Stanley projects that capital spending by the five largest AI “hyperscalers” will top $1.1 trillion in 2027. To put that in perspective: that is more than the projected US national defense budget.

2. The Profit-Wage Disconnect

The most jarring distortion is the widening gap between corporate profits and worker pay. While S&P 500 earnings are rocketing—specifically for companies providing the “picks and shovels” of AI like NVIDIA—labor’s share of total business output has hit historic lows.

  • The Corporate Side: Profits are being driven by extreme efficiency and high-margin AI services.
  • The Human Side: Real wages, after inflation, have struggled to keep pace. Workers are feeling a “vibecesssion”—a psychological recession—even when the data says the economy is booming. The fear of replacement by AI is creating a mood of cautious pessimism that isn’t reflected in the soaring Nasdaq.

3. The Trade Deficit Illusion

Usually, a widening trade deficit is a sign of a weak domestic manufacturing base. In the Age of AI, it’s a sign of a domestic investment boom.

Because the US leads in AI software and design but relies on overseas foundries (primarily in Taiwan and South Korea) for high-end semiconductors, every dollar spent building a domestic data center often results in thousands of dollars of imported hardware. This is distorting our trade balance, making the US look “weaker” on paper even as it cements its role as the global hub for AI innovation.


4. Is It a Bubble or a Foundation?

The “B-word” is on everyone’s lips. Skeptics point to the 1990s dot-com era, noting that we are currently betting the entire economy on “scaling”—the idea that bigger models and more data will inevitably lead to AGI (Artificial General Intelligence).

If this bet pays off, we are building the infrastructure of a new civilization. If it doesn’t, the distortion could lead to a massive correction. We’ve reached a point where the US economy is “Too Big to Fail” on AI. As David Sacks, the administration’s AI czar, recently noted: a reversal in AI investment wouldn’t just be a tech correction—it would risk a full-scale national recession.

The Bottom Line

We are living in an era of synthetic growth. The numbers are real, but they don’t feel real to the average person because they are concentrated in a digital frontier. As AI continues to distort everything from job security to trade routes, the challenge for 2026 and beyond isn’t just “how to grow,” but how to ensure that the AI boom doesn’t leave the rest of the economy in its shadow.

The hand of the market is no longer just “invisible”—it’s becoming algorithmic.

Contact Factoring Specialist, Chris Lehnes

US Adds 115,000 Jobs in April As Energy Prices Skyrocket

The latest Labor Department report released today, May 8, 2026, reveals a complex picture of the American economy. While the addition of 115,000 jobs in April far exceeded the conservative forecasts of 65,000, this hiring momentum is colliding with a volatile energy market and geopolitical tensions that are keeping consumers—and the Federal Reserve—on edge.

The April Jobs Numbers: A Surprising Resilience

Despite a year of uneven growth and high interest rates, the labor market continues to find its footing. The 115,000 gain marks a significant win for an economy that many feared was cooling too rapidly.

  • Unemployment Rate: Held steady at 4.3%, a remarkably low figure given the broader economic headwinds.
  • Sector Highlights: Growth was fueled by health services, education, and construction. Notably, the boom in AI data center construction is providing a sturdy floor for blue-collar employment.
  • Small Business Bounce: Much of the hiring surge came from small businesses (fewer than 20 employees), suggesting that local optimism remains resilient despite macro-level volatility.


The Energy Crisis: A Shadow Over the Recovery

While the job gains are a reason for celebration, they are being offset by a painful reality at the pump and in utility bills. Crude oil prices have breached the $100-per-barrel mark, driven largely by recent hostilities in the Strait of Hormuz.

For the average American household, the “energy tax” is real. Rising gas prices are eating into the gains from recent tax refunds and wage growth. This creates a “push-pull” dynamic:

  1. The Push: Robust hiring and steady wages ($6.6\%$ growth for job-switchers) give consumers spending power.
  2. The Pull: Skyrocketing energy costs increase the cost of goods and transportation, effectively neutralizing those wage gains for many families.

What This Means for the Federal Reserve

The Fed is now in a delicate position. Usually, a strong jobs report would signal that the economy can handle higher interest rates. However, with energy prices driving “cost-push” inflation, Fed Chair Jerome Powell and his team must decide if the labor market is stable enough to wait out the energy spike or if they need to pivot to protect growth.

Traders are currently betting on a “stable backdrop,” but the volatility in the Middle East remains the ultimate wildcard. If energy prices continue their upward trajectory, the modest 115,000-job gain might be harder to replicate in May.


Looking Ahead

The April report proves that the U.S. economy is more durable than skeptics predicted, but it also highlights our vulnerability to global supply shocks. As we move into the summer months, all eyes will be on two things: the price of a gallon of gas and whether the AI-driven infrastructure boom can continue to carry the weight of the labor market.

Bottom Line: The American worker is still in demand, but the cost of living—fueled by a chaotic energy market—is the primary threat to this hard-won stability.

Contact Factoring Specialist Chris Lehnes

https://www.chrislehnes.com/wp-content/uploads/2026/05/fedcbamp_.mp4

Chris Lehnes – Factoring Specialist – Quick Cash Against Invoices

Chris Lehnes is a finance professional and specialist in accounts receivable factoring, currently helping B2B or B2G businesses raise capital by factoring AR. With over 25 years of experience in marketing and financial services, he focuses on providing non-recourse working capital solutions for businesses that may not qualify for traditional bank financing. [1, 2, 3, 4]

Professional Expertise

Lehnes operates primarily as an educator and intermediary in the factoring industry, helping companies bridge cash flow gaps through their receivables. His expertise includes: [1, 2]

  • Target Industries: He provides funding for a variety of sectors including energy, healthcare, manufacturing, and staffing.
  • Specialized Funding: He specializes in “challenging deals,” such as startups, companies with high customer concentrations, or those with weak personal credit.
  • Financial Content: Lehnes is a prolific content creator, maintaining a YouTube channel focused on factoring tutorials, market analysis, and audiobook summaries related to leadership and business psychology. [1, 2, 3, 4, 5]
  •  

Career & Background

  • Education: He studied Economics at Lafayette College and attended River Dell Regional High School.
  • Online Presence: He actively shares insights on LinkedIn and Twitter/X, often discussing economic barometers like lumber price fluctuations and their impact on residential construction.
  • Public Speaking: He frequently appears on podcasts and webinars, such as the Credit on the Go Podcast, to explain the strategic benefits of factoring. [1, 2, 3, 4, 5]

Chris Lehnes manages non-recourse factoring at Versant Funding, where the primary requirement for funding is the credit quality of the account debtor (the customer paying the invoice), rather than the financial strength of the business itself. [1, 2, 3]

Funding Criteria & Terms

  • Sales Volume: Targets companies with B2B or B2G sales ranging from $100,000 to $30 million per month.
  • Non-Recourse Protection: Versant assumes the credit risk; if the customer fails to pay due to insolvency, the business is not required to reimburse Versant.
  • Flexible Concentration: Unlike many lenders, Lehnes often facilitates deals with 100% customer concentration, where a business has only one major client (e.g., a large municipality or multinational corporation).
  • Funding Speed: Deals can often be funded within one week because traditional underwriting of the borrower’s balance sheet is not required.
  • Typical Fees: Costs are generally around 2.5% of the invoice amount for each month it remains outstanding.
  • Excluded Industries: Generally does not factor for the medical (provider-side) or construction industries. [1, 2, 3, 4, 5, 6, 7]
  •  

Latest Market Analysis (2025–2026)

Lehnes frequently updates his YouTube and Substack with analyses of the broader economy. Recent highlights include:

Chris Lehnes frequently facilitates complex funding through Versant Funding LLC, often solving liquidity crises for businesses that traditional banks might reject. [1, 2]

Selected Case Studies

  • $30 Million Furniture Manufacturer (2025): Provided a massive non-recourse facility to replace a non-renewed loan from a previous factor. This deal supported the company through a significant corporate restructuring.
  • $1.4 Million Auto Equipment Manufacturer (2026): Funded a company supplying global automotive giants. Despite the client’s slow-paying receivables, Versant scaled the facility automatically because the customers were “the strongest on the planet”.
  • $3 Million Housewares Distributor (2025): Stepped in when the client’s existing factor imposed funding limits that prevented them from fulfilling new orders. Versant consolidated existing loans and provided an advance against all outstanding receivables.
  • $1.8 Million Adolescent Group Home (2024): Originated a facility for a newly formed social services provider. Because state and county organizations pay slowly, this factoring arrangement provided the necessary liquidity for them to expand into new regions.
  • Energy Sector Support (2026): Recently focused on the oil and gas industry, helping suppliers bridge working capital gaps caused by the long payment cycles of major energy corporations. [1, 2, 3, 4, 5, 6, 7, 9]


Contact Information

You can reach Chris Lehnes directly for a pre-qualification review or to discuss a specific transaction:

Chris Lehnes and Versant Funding prioritize non-recourse factoring because it allows them to fund high-growth or struggling businesses based solely on their customers’ creditworthiness rather than the business’s own financial history. [1, 2]

Recourse vs. Non-Recourse Factoring

The primary difference is who bears the financial risk if a customer fails to pay an invoice. [1, 2]

  • Recourse Factoring: This is the most common and typically the least expensive option. Under this arrangement, if your customer does not pay their invoice within a set period (usually 60–90 days), your business is responsible for buying back that invoice or replacing it with a fresh one. You retain the ultimate credit risk.
  • Non-Recourse Factoring: In this model, the factoring company (like Versant) assumes the credit risk. If your customer becomes insolvent or files for bankruptcy, you are not required to pay back the advanced funds. Because the factor takes on more risk, fees are typically higher, and they require strict credit approval of your customers. [1, 2, 3, 4, 5, 6, 7, 8, 9]
  •  

Referral Partnership Guidelines

Lehnes actively collaborates with intermediaries, including commercial loan brokers, accountants, and consultants, to source “difficult” deals that traditional banks cannot touch. [1, 2]

  • Recurring Commissions: Unlike real estate or one-time loan fees, Lehnes offers recurring monthly commissions for the entire life of the deal. If a client factors for three years, the referral partner receives a check every month for those three years.
  • Strategic Bridge: He encourages partners to use factoring as a short-term bridge (often 24 months) to help companies stabilize until they can qualify for bank financing or complete an equity raise.
  • Simple Prequalification: To refer a client, you generally only need to provide the client’s industry and a list of their major customers (A/R Aging report). Because Versant does not require full financial audits of the borrower, pre-approval can happen very quickly. [1, 2, 3]

To move forward with a deal for Chris Lehnes at Versant Funding, you typically need a streamlined submission package because they do not underwrite the borrower’s financials—only the collateral (the invoices).

1. Required Documents for a Quote

You can typically get a term sheet or preliminary proposal by submitting just two or three items.

  • Current A/R Aging Report: This is the most critical document. It must show the names of the customers (account debtors), the amounts they owe, and how long the invoices have been outstanding (0-30, 31-60, 60-90 days).
  • Customer List with Limit Requests: A list of the specific customers the client wants to factor, including their addresses and the amount of credit limit requested for each. Versant uses this to run credit checks on the debtors.
  • Sample Invoices: A few examples of the invoices they intend to factor to verify they represent completed work or delivered goods (not progress billing or guaranteed sales).
  • Simple Application:
    • Note: You generally do NOT need to submit tax returns, P&L statements, or balance sheets for a preliminary quote, as Versant relies on the credit of the account debtors. [1, 2, 3]

Next Step:
If you have a client ready, you can email the A/R Aging Report directly to chris@chrislehnes.com  to request a term sheet.

Factoring: Quick Cash for GovCon

  • $100k to $30 Million to GovCon
  • Non-Recourse Factoring
  • Flexible Terms
  • Federal, State and Municipal AR Eligible
  • No size cap on most facilities

Include our proposal in your RFP response to demonstrate you have access to the cash needed to take on large contracts.

Government Contractors can obtain funds in as quick as a week backed by their accounts receivable.

Chris Lehnes | Factoring Specialist | 203-664-1535| chris@chrislehnes.com


For government contractors, winning a contract is a major milestone. However, the celebration often fades when the reality of lengthy payment cycles sets in. While the government is a reliable payer, it isn’t always a fast one. Net-30, Net-60, or even Net-90 payment terms can create a significant “cash gap” that stalls operations.

This is where Accounts Receivable (AR) Factoring—often called “Invoice Factoring”—becomes a strategic advantage.


What is AR Factoring?

At its core, AR factoring is a financial transaction where a business sells its unpaid invoices to a third party (a factor) at a discount. Instead of waiting months for the government to process a payment, the contractor receives a significant portion of the invoice value immediately.

How the Process Works for Contractors:

  1. Deliver the Work: You complete your service for the government agency and issue an invoice.
  2. Sell the Invoice: You sell that invoice to a factoring company.
  3. Receive Advance: The factor advances you 75% to 85% of the invoice value, usually within 24–48 hours.
  4. Government Pays: The government agency pays the factor directly according to the original terms.
  5. Final Rebate: Once the factor is paid, they release the remaining balance to you, minus a small factoring fee.

https://www.chrislehnes.com/wp-content/uploads/2026/05/GovCon.mp4

Key Benefits for Government Contractors

1. Bridge the “Mobilization” Gap

Government projects often require heavy upfront costs—hiring specialized personnel, purchasing equipment, or clearing security hurdles. Factoring provides the immediate working capital needed to mobilize quickly without draining your cash reserves.

2. Meet Payroll with Confidence

The government doesn’t care if your invoice is stuck in “processing” when your employees’ rent is due. Missing payroll is a fast way to lose a talented team and jeopardize your contract. AR factoring ensures you have the liquidity to meet every payroll cycle, regardless of when the Treasury sends the wire.

3. Ability to Compete for Larger Contracts

Small to mid-sized contractors often shy away from “prime” opportunities because they lack the balance sheet to sustain long-term projects. Factoring scales with your growth. The more you invoice, the more capital you can access, allowing you to bid on larger, more lucrative multi-year contracts.

4. No New Debt

Unlike a traditional bank loan, factoring is not debt. You aren’t borrowing money; you are accelerating the payment of money you have already earned. This keeps your debt-to-equity ratio clean, which can be beneficial for future bonding requirements.


Navigating the “Assignment of Claims Act”

One unique aspect of factoring for government work is the Assignment of Claims Act. This federal law allows a contractor to assign the payments of a government contract to a financing institution.

A factor experienced in government contracting will handle the specific paperwork (Notice of Assignment) required to ensure the government sends payments to the correct address. Working with a factor who understands these regulatory nuances is critical to a smooth experience.


Is Factoring Right for You?

If your business is growing faster than your bank account, or if slow government payments are preventing you from taking on new work, AR factoring is a powerful tool. It transforms your most stagnant asset—your unpaid invoices—into a liquid engine for growth.

Don’t let a “Net-60” term hold your business back. Accelerate your cash flow and keep your mission on track.

Chris Lehnes | Factoring Specialist | 203-664-1535| chris@chrislehnes.com

The Red Line: Why U.S. Debt Topping 100% of GDP Matters

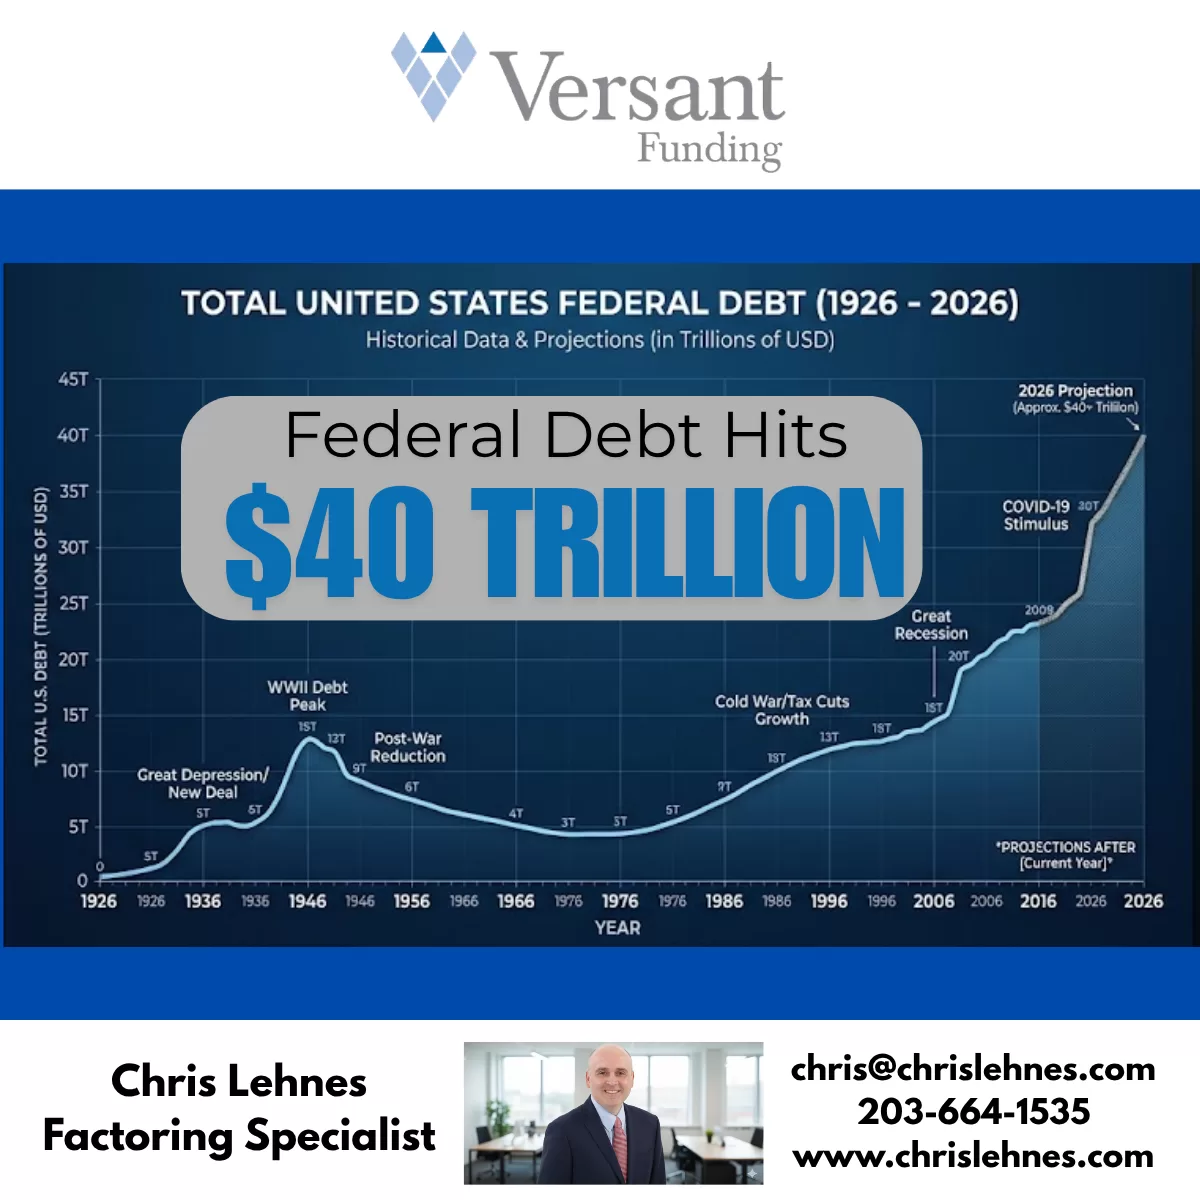
Debt reaches $31 Trillion

For the first time since the aftermath of World War II, the United States has reached a fiscal milestone that was once a distant “what-if” scenario: the national debt has officially surpassed 100% of the country’s Gross Domestic Product (GDP).

As of March 31, 2026, the debt held by the public reached $31.27 trillion, while the total annual economic output sat at $31.22 trillion. In simple terms, we now owe more as a nation than we produce in an entire year.

While “trillions” can feel like abstract Monopoly money, this 100.2% ratio represents a fundamental shift in the American economic landscape. Here is what you need to know about why this happened and what it means for the future.


How Did We Get Here?

This wasn’t an overnight accident. It is the result of decades of “fiscal kicking the can.” The surge to 100% was fueled by three primary engines:

  1. Structural Deficits: For years, the government has spent roughly $1.33 for every $1.00 it collects in revenue.
  2. The Interest Trap: As the total debt grows, so do the interest payments. In 2026, the U.S. is projected to spend approximately $1 trillion on interest alone—surpassing the entire national defense budget.
  3. Demographic Shifts: An aging population is naturally drawing more heavily on Social Security and Medicare, programs that make up a massive portion of mandatory spending.

Why the 100% Threshold Matters

Economists often debate whether there is a “magic number” where debt becomes fatal. While 100% isn’t an immediate “cliff,” it serves as a critical psychological and economic warning light for several reasons:

  • Slower Economic Growth: Historical data suggests that when a nation’s debt exceeds 90% of GDP, average annual growth tends to slow. Resources that could be used for private investment or infrastructure are instead diverted to servicing old debt.
  • Reduced “Crisis Cushion”: When the next pandemic, recession, or war hits, the government has less “dry powder” to respond. Borrowing your way out of a crisis is much harder when your credit card is already maxed out relative to your income.
  • Generational Equity: The debt essentially represents a “tax” on future generations. Today’s spending is being financed by the earnings of Americans who haven’t even entered the workforce yet.

The Cost to the Average Household

To bring these massive numbers down to earth, the Senate Joint Economic Committee’s April 2026 update provides a sobering breakdown:

  • Debt per Person: Approximately $114,000
  • Debt per Household: Approximately $289,000

Is There a Way Out?

The U.S. has been here before. After 1945, the debt-to-GDP ratio was successfully whittled down to 34% by 1980. However, that was achieved through a unique combination of post-war industrial dominance, a massive “Baby Boom” workforce, and rapid GDP growth.

Today, the path is narrower. Solutions generally fall into three difficult categories:

  1. Entitlement Reform: Adjusting Social Security and Medicare to match modern life expectancies.
  2. Revenue Increases: Raising taxes or closing loopholes to narrow the deficit.
  3. Growth Incentives: Policies designed to make the “GDP” side of the ratio grow faster than the “Debt” side.

The Bottom Line

Crossing the 100% threshold is a “reckoning” moment. It signals that the era of “cheap” borrowing is over. As interest payments continue to eat a larger slice of the federal pie, the pressure on the American taxpayer—and the pressure to make hard political choices—will only intensify.

The red line has been crossed. The question now is whether we have the political will to head back toward the black.

Contact Factoring Specialist, Chris Lehnes