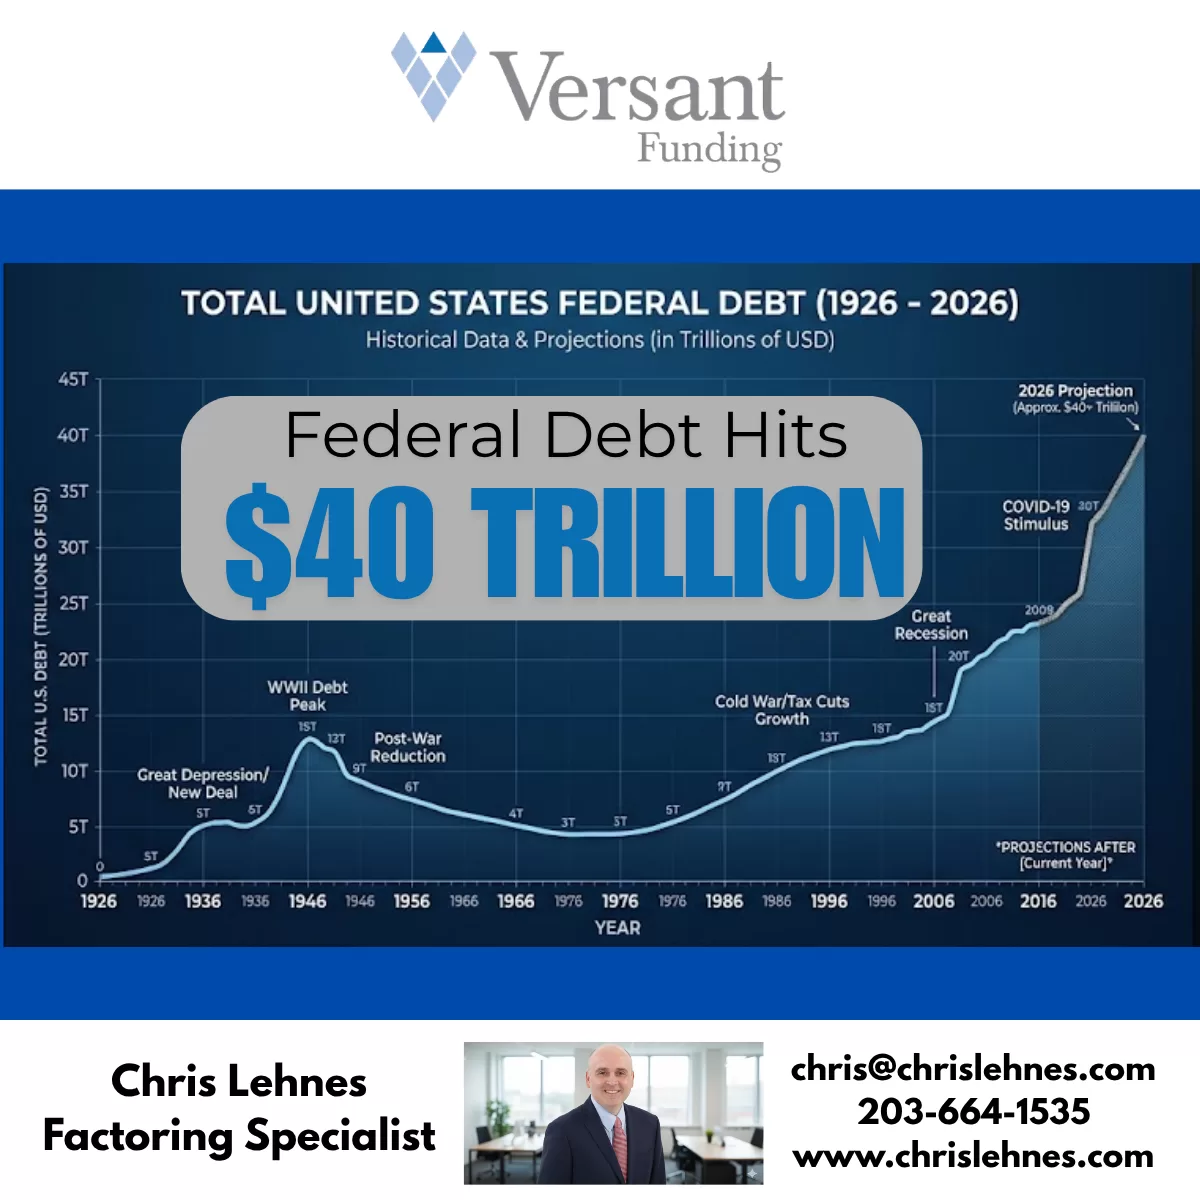
While that figures is symbolically significant, it is not economically significant. Most investors and economists focus on other metrics, like the Debt to GDP ration, a better sense of an country’s borrowing ability.
But, $40 trillion is a big number, and will draw attention to an unsustainable fiscal trajectory.
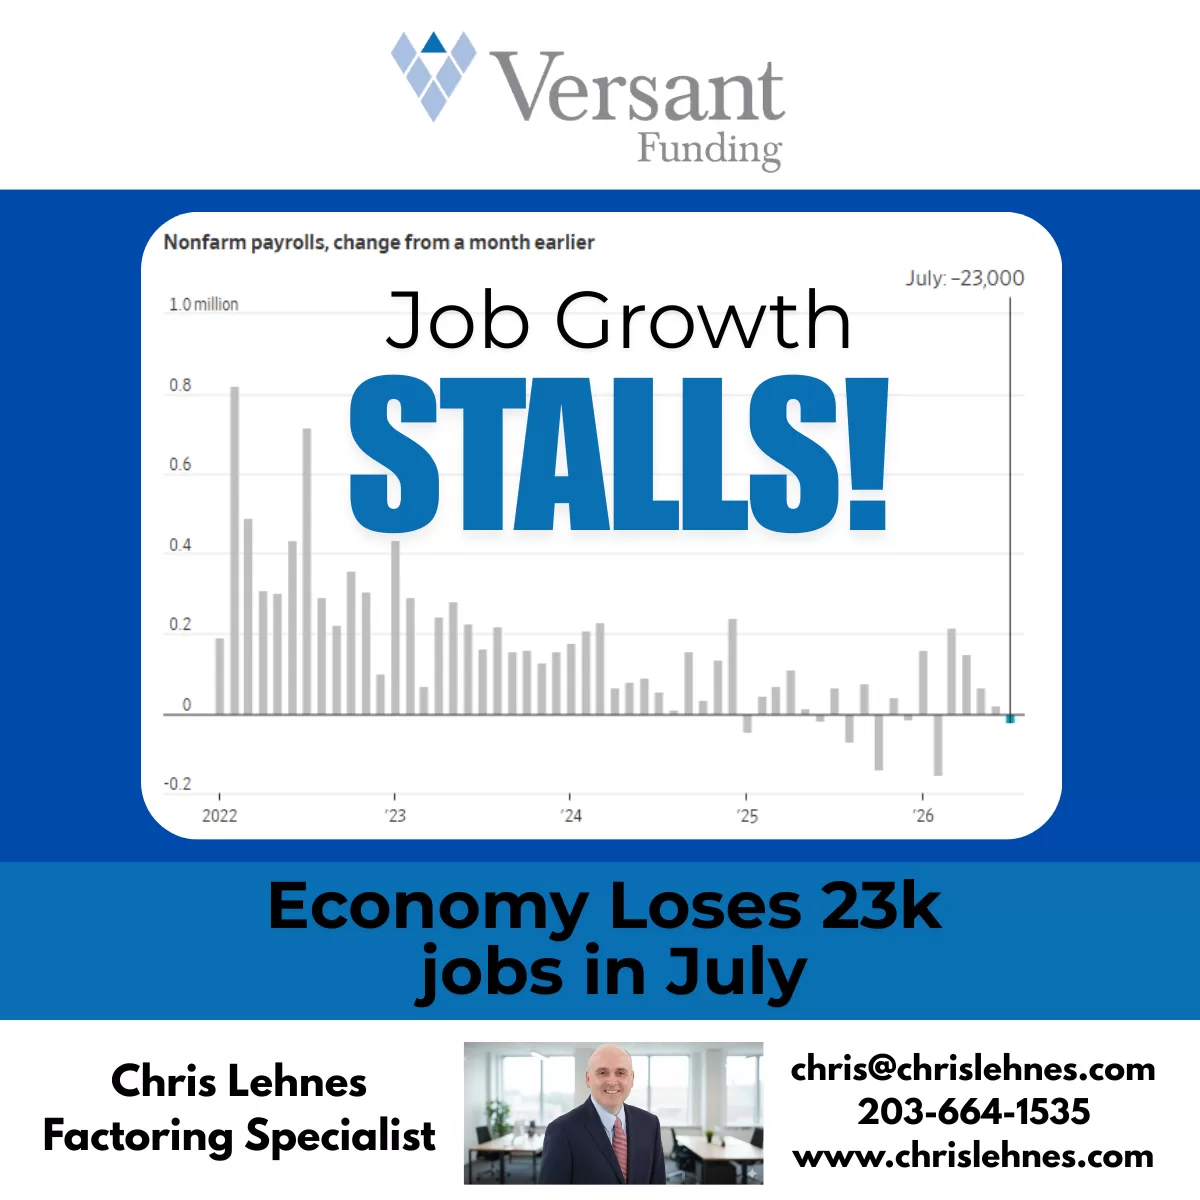
Job Growth: The U.S. labor market lost jobs in July, an surprising contraction likely to reignite questions about the economy’s strength when it is also facing elevated inflation.
The latest U.S. Department of Labor report showed that the economy lost 23k jobs in July, a large shortfall undercutting the gain of 83k that economists surveyed by The Wall Street Journal had expected.
Revisions to prior month results showed that the economy added 103k fewer jobs in May and June.
The unemployment rate reduced to 4.1%, from 4.2% in June, even though fewer people were working due to even more individuals existing the workforce.
In yet another troubling sign for the labor market, the Bureau of Labor Statistics said that it revised down the prior two months by a combined 103,000. May’s jobs total was cut by 66,000 to 129,000 total jobs added, while June’s total was lowered by 37,000 to a total gain of 57,000.
Economists had been expecting wages to continue pacing at 3.5% from a year ago, but instead wage growth slowed.
“The labor market is stalling again,” wrote Heather Long, chief economist at Navy Federal Credit Union, who called the report “bleak.”
The BLS said employment contracted the most in “local government education,” which declined by 50,000 roles, likely reflecting teachers during summer break. It also flagged a contraction of 19,000 roles in the retail industry. The financial industry shed 14,000 roles.
The agency’s data also showed a 5,000 payroll gain in the manufacturing sector in July and an additional 22,000 roles in construction. These bright spots come as the AI data center boom has benefited some industries, but deeply divided many communities where the centers are located.
Friday’s report likely eases some pressure on the Federal Reserve, which had been widely expected to hike the federal funds rate — potentially as soon as September.
A “Side Hustle” Economy Not a Small Business Boom While 2025 saw a record 6 million new business applications, 70% were identified by the Census Bureau as “likely non-employers.” Only 1.7 million actually intend to hire paid employees [53:18].
The Founder Obsession: Scott argues this isn’t an entrepreneurial boom, but rather young people disillusioned by corporate jobs starting side gigs. This trend is highlighted by a 69% surge in users adding the title “Founder” to their LinkedIn profiles [01:07:03].
Career Advice: Scott strongly advises young professionals against romanticizing entrepreneurship, noting that the fastest and safest path to wealth is often joining an established, fast-growing corporation as an early employee (e.g., employee 10 to 1,000) rather than taking on the brutal emotional and financial toll of starting a company from scratch [01:01:09].
According to the Census Bureau, Americans filed nearly 6 million applications to start new businesses last year. While that is the most on record, the data doesn’t tell the whole story. Only 1.7 million of those applications were identified as high-propensity businesses, meaning they actually intend to hire paid employees. The vast majority of the applications were for entrepreneurs with no plans to hire anyone.
This really grabbed my attention because I’ve been seeing arguments that we are in the midst of a small business boom. I was ready to run with it—it’s a reason to be optimistic. The number of new business applications has exploded, up 10% year-over-year to hit record highs, and this trend has continued into the first half of this year. However, most of these businesses are categorized as “likely non-employer businesses,” meaning they have a very low likelihood of producing actual payrolls.
The Census Bureau uses a methodology that looks at indicators like, Have you indicated that you’re hiring?, Have you provided a first wages-paid date?, and Are you in an industry with strong employment demand? It turns out that more than 70% of these new businesses we were supposed to be celebrating are likely non-employers. This seems like a bit of a fake boom.
This blew me away. In terms of how the sausage gets made here, we do editorial calls where analysts pitch stories, and I comment on them, and our producer decides what we’ll cover. This story just blew my mind because I have this whole “AI optimist” pitch, and one of my favorite stats is that new business formation is at a record high. This data completely punctured that argument because, once again, numbers can be misleading. Six million new business applications sounds like a renaissance of the American entrepreneurial spirit. But, as you pointed out, only 1.7 million (about 30%) were high-propensity.
The other 4 million-plus applications represent one person, a laptop, and an LLC. When you try to start a restaurant, you’re going to hire 10, 20, or 30 people. When you’re starting a food blog as a side hustle, that’s not exactly great for the employment market. What the data actually shows is that this isn’t a small business boom; it’s a side-hustle economy dressed up in Census Bureau language.
In some ways, it probably reflects something unhealthy about the economy. One in three adults says they are planning a business or side hustle in 2026, which is up 94% year-over-year. There’s something very good about that, but the question is: is it entrepreneurial confidence, or economic anxiety wearing a founder’s hoodie? People aren’t starting these companies because times are good; they’re hedging because they can’t afford to pay their rent with their main job. This is one of those times I realized I don’t know what I don’t know, and this supposed new business boom isn’t really a boom at all.
I think this is an important data point, and I want to clarify it for everyone: 70% of these new businesses are likely non-employers according to the census. If you compare this to the mid-2000s, the share of likely non-employer businesses has doubled. So yes, we are seeing new businesses, but most of them are not actually contributing to the broader economy.
Why is this happening? One theory is the rise of the AI-enabled solopreneur—that AI allows you to form your own business easily. That might be part of it, but this trend began way before AI. It exploded during COVID, where suddenly, all of these non-employer businesses skyrocketed. Another theory is that more people are self-employed now—they quit their jobs and are running solo companies. But if you look at the self-employment rate, the number of self-employed Americans is actually down significantly over the past few years.
This leads me to one logical conclusion: these are mostly side gigs. It’s someone who is bored at work. They are still employed and working remotely, but they want to start a lifestyle brand, make an Instagram account, or write a Substack. If they get really excited, they might create an LLC. But to be clear, that’s not a business that is contributing to the economy. It’s essentially a hobby and a legitimized vehicle to express yourself out of the boredom you feel at your actual job.
This is becoming a real trend, especially among young people, because they are so disillusioned by the notion of traditional work—being an employee and receiving a wage. It reflects that philosophy of ‘don’t be a wage slave, start your own business, be an entrepreneur, be a hustler.’ The entrepreneurship mindset has become such a hot topic in our digital, social media-driven world that we are all fantasizing about it. People create these little side hustles so they can say, ‘I’m an entrepreneur now.’ But in reality, you aren’t, because you still work for a company and you aren’t generating a livable income off the side business that supposedly makes you a founder.”
Versant funding
Food processing companies can fund their growth using the cash provided by accounts receivable factoring. Contact Chris at Versant Funding to learn if your client is a fit for factoring. Factoring can also meet the cash needs of staffing companies looking to expand. Contact Factoring Specialist Chris Lehnes to learn if your staffing client is a factoring fit.
Impact of Iran War Ripple through the Economy Due to Gas Prices
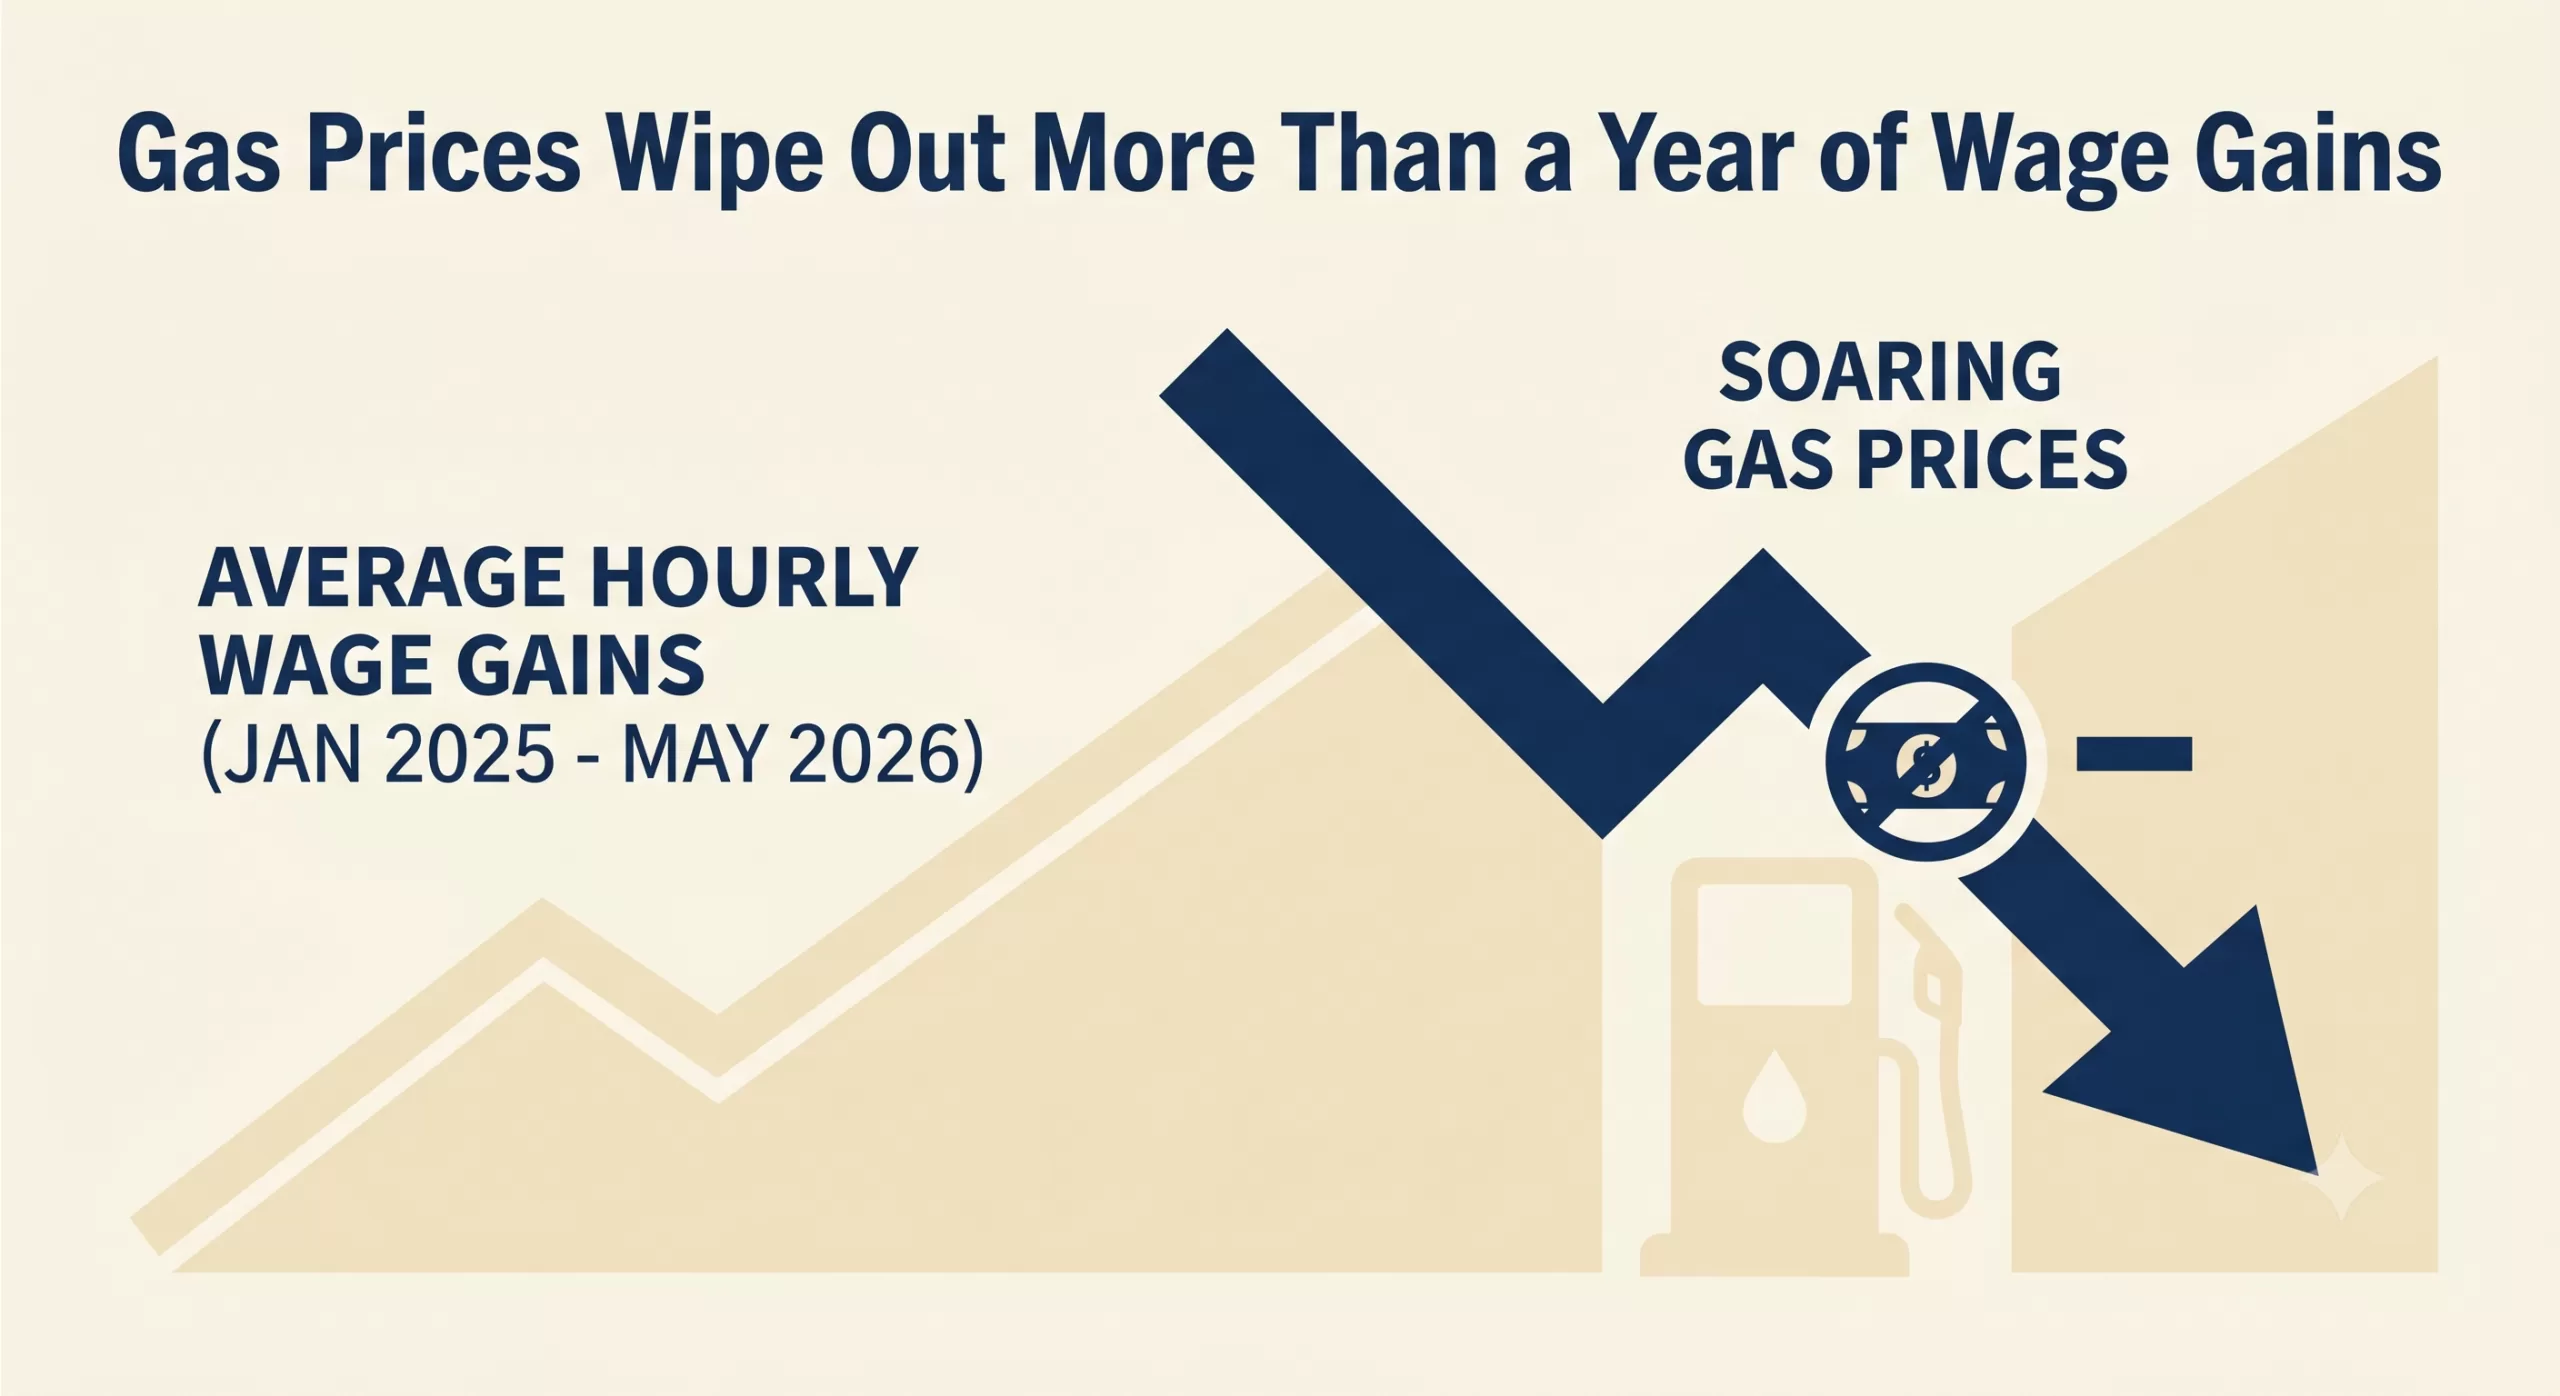
The latest macroeconomic indicators including gas prices paint a challenging picture for both consumers and businesses. Following the Labor Department‘s recent reports, it is clear that soaring energy costs have effectively neutralized recent progress in worker compensation. With top-line inflation advancing to 4.2% in May—the highest level in three years—and gasoline prices surging, real average hourly earnings have been pushed all the way back to January 2025 levels.
For the second consecutive month, inflation has outpaced wage growth. The reality is that gas prices have wiped out more than a year of wage gains.
The Macroeconomic Squeeze
The ripple effects of this inflationary spike are significant. The Federal Reserve now faces a complex policy dilemma as they weigh interest rate decisions against a backdrop of stubborn inflation and squeezed household budgets. When wages lag behind inflation, consumer spending inevitably cools, particularly among middle- and lower-income brackets who are forced to allocate a larger share of their take-home pay to essentials like fuel and groceries.
What This Means for Business Owners
While the headlines focus on the consumer at the pump, small and mid-sized businesses are absorbing these shocks on multiple fronts:
Increased Operational Costs: Surging fuel prices directly inflate the cost of transportation, logistics, and supply chain operations.
Margin Compression: Businesses face the difficult choice of passing higher costs onto increasingly price-sensitive consumers or absorbing the losses and shrinking their profit margins.
Wage Pressure: Even though real wages are falling, nominal wage demands remain high as employees seek relief from the rising cost of living, straining payroll budgets.
Navigating the Cash Flow Crunch
During periods of high inflation and uncertain interest rates, liquidity becomes a paramount concern. Industries heavily reliant on steady cash flow—such as manufacturing, staffing, healthcare, and distribution—can find their working capital severely constrained when expenses rise faster than revenues can be collected.
Waiting 30, 60, or 90 days for clients to pay outstanding invoices is a luxury many companies cannot afford when the cost of doing business is escalating weekly. Accounts receivable factoring offers a strategic mechanism to bridge this gap. By converting outstanding B2B invoices into immediate working capital, business owners can cover rising operational costs, meet payroll obligations, and navigate economic volatility without taking on new debt or waiting on unpredictable macroeconomic shifts.
As we continue to monitor the inflation data and the Fed’s next moves, maintaining robust working capital will be the defining factor for businesses looking to weather this storm.
Today marks a significant turning point in European monetary policy: the European Central Bank (ECB) has officially reversed course, raising its key interest rates for the first time in nearly three years.
After an extended period of cuts and holds, the era of steadily declining borrowing costs in the Eurozone has temporarily hit a wall. Let’s break down the data, the underlying causes, and what this means for the broader economy.
The Decision: By the Numbers
In a move widely anticipated by financial markets and economists, the ECB’s Governing Council elected to raise its key interest rates by 0.25 percentage points (25 basis points).
Here is a quick breakdown of where the central bank’s key rates stand effective immediately:
ECB Facility
Previous Rate
New Rate (June 2026)
Deposit Facility
2.00%
2.25%
Main Refinancing Operations
2.15%
2.40%
Marginal Lending Facility
2.40%
2.65%
This decision officially ends a cycle that began back in September 2023, representing a decisive reaction to shifting economic realities on the ground.
Why is the ECB Hiking Rates Now?
The ECB has a single, primary mandate: to maintain price stability by targeting an inflation rate of 2.0%. The decision to hike rates is a direct response to recent data showing that inflation is moving in the wrong direction.
Headline Inflation Surge: In May 2026, Eurozone consumer prices rose to 3.2% year-over-year. This marks a significant acceleration from earlier in the year and blows past the central bank’s comfort zone.
The Energy Shock: A major driver behind this inflationary spike is the ongoing geopolitical conflict in the Middle East. Disrupted shipping routes and volatile commodity markets caused energy prices to jump nearly 11% last month compared to the same period last year.
Core Inflation Creep: The energy shock isn’t isolated. Core inflation—which strips out highly volatile food and energy costs—rose to 2.5%. This indicates that higher energy overheads are beginning to bleed into the broader costs of everyday goods and services.
What Does This Mean for the Eurozone?
When the ECB pulls the interest rate lever, the effects ripple through the entire financial system. Here is what to expect:
More Expensive Borrowing: For consumers and businesses, the cost of credit is going up. Homeowners holding variable-rate or tracker mortgages will see their monthly repayments increase almost immediately.
A Squeeze on Growth: While higher interest rates are necessary to cool down inflation, they simultaneously suppress economic activity. Reflecting the strain of higher energy costs and tighter financial conditions, the ECB has already revised its growth forecasts downward, anticipating the Eurozone economy will grow by a sluggish 0.8% in 2026.
Currency Impacts: Higher interest rates generally make a currency more attractive to yield-seeking investors. A hawkish stance from the ECB typically provides upward support for the Euro (EUR) against other major currencies, provided the broader economic outlook doesn’t deteriorate too sharply.
Looking Ahead: Is This the Start of a New Cycle?
The prevailing question for markets is whether this is a isolated adjustment or the beginning of a new tightening cycle.
Current market consensus suggests this won’t be a one-off event. Many analysts are pricing in at least one or two more quarter-point increases before the end of the year, which could bring the deposit rate up to 2.50% or 2.75%. However, ECB leadership has emphasized that future decisions will remain strictly “data-dependent.” The Governing Council will evaluate the ongoing impact of energy prices, geopolitical stability, and wage growth on a meeting-by-meeting basis.
The takeaway is clear: the ECB’s latest pivot highlights how rapidly external shocks can upend economic stability, forcing central banks to prioritize fighting inflation over stimulating growth.
If you’ve been keeping an eye on the economic headlines lately, you might have braced yourself for a sluggish jobs report this May. With rising inflation and the economic ripple effects of the ongoing conflict in Iran, many analysts were predicting a significant cooldown in hiring.
But the U.S. labor market just threw a massive curveball.
Here is a breakdown of the May 2026 jobs report, what the numbers actually mean, and why the American economy continues to show surprising resilience.
The Headline Numbers: Blowing Past Estimates
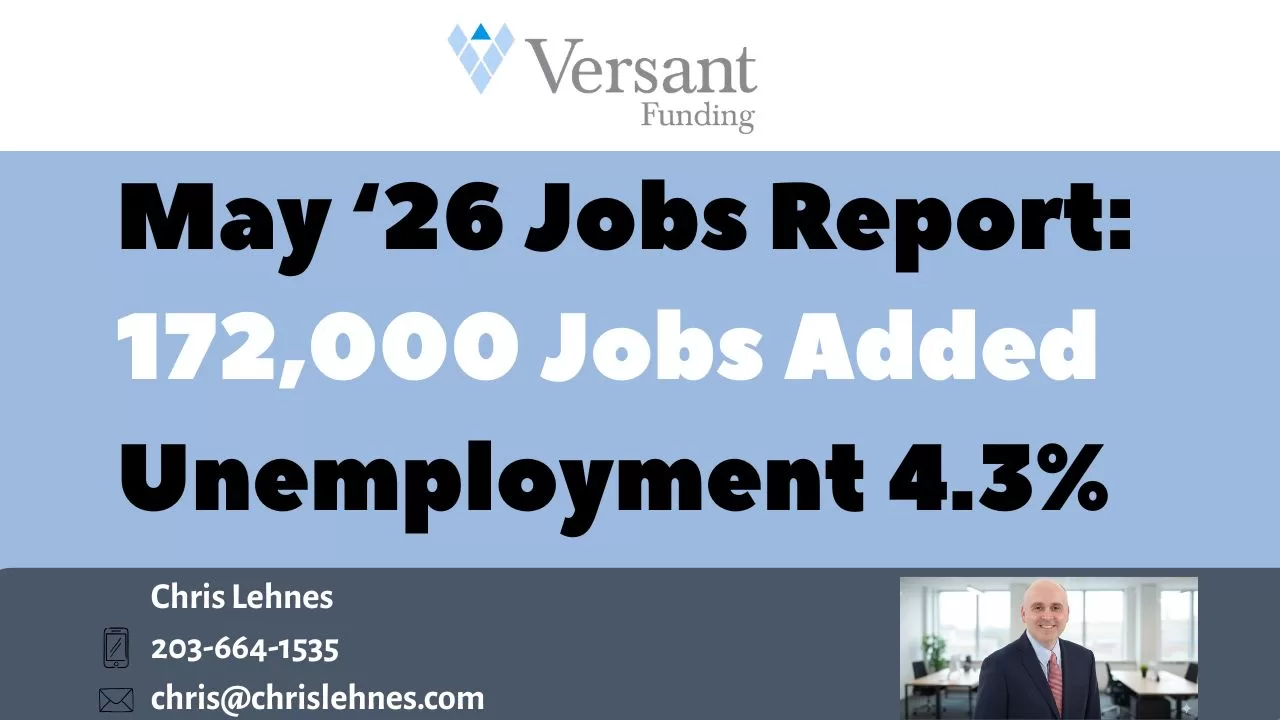
Economists were largely projecting a modest gain of around 85,000 jobs for May. Instead, the Labor Department revealed that U.S. employers added a robust 172,000 new jobs.
Total Jobs Added: 172,000 (vs. 85,000 expected)
Unemployment Rate: Held steady at 4.3%
Wage Growth: Average hourly earnings ticked up by 0.3% month-over-month.
April Revisions: April’s numbers were also sharply revised upward from 115,000 to an impressive 179,000.
This wasn’t just a slight beat; it was a doubling of expectations, indicating that businesses are still finding reasons to hire and expand, even in an uncertain macroeconomic climate.
Where Are the Jobs Coming From?
While the headline number is strong, the growth wasn’t entirely uniform across the board. The heavy lifting was done by a few key sectors:
Healthcare and Social Services: Continuing a long-running trend, healthcare remains a massive engine for job creation, accounting for a significant chunk of the new roles.
Leisure and Hospitality: As the weather warms up, consumer demand for travel and dining out remains steady, prompting strong hiring in this sector.
Local Government: Public sector hiring also saw notable gains.
Conversely, some sectors felt the pinch. Employment in financial activities slipped slightly, reflecting tighter borrowing conditions and shifting corporate strategies.
Resilience Amid Global Headwinds
The most fascinating takeaway from this report isn’t just the sheer number of jobs added—it’s the context in which they were created.
Since the escalation of the war in Iran earlier this year, global energy markets have been incredibly volatile. Spiking oil prices have renewed fears of inflation, putting pressure on consumer wallets and business operational costs alike. Despite these immense headwinds, the domestic labor market has absorbed the shock remarkably well.
The fact that employers are still confident enough to add 172,000 workers to their payrolls suggests an underlying structural strength in the U.S. economy that is, for now, overriding geopolitical anxieties.
What This Means for the Federal Reserve
Of course, a hot jobs report complicates things for the Federal Reserve.
When the labor market is strong and wage growth is steady, inflation tends to remain sticky. Prior to this report, there was speculation that the Fed might keep interest rates flat for the rest of the year. However, this display of economic resilience might push policymakers in a more hawkish direction. While the steady 4.3% unemployment rate means the labor market isn’t overheating, markets are now bracing for the possibility that the Fed could lift rates at least once by the end of 2026 to keep inflationary pressures in check.
The Bottom Line
The May 2026 jobs report is a potent reminder that the U.S. economy rarely behaves exactly as modeled. While the challenges of inflation and global conflict are very real, the underlying demand for labor remains undeniably robust. Whether this momentum can be sustained into the summer remains to be seen, but for now, the job market continues to defy the odds.
The Invisible Hand is Getting a Digital Upgrade (and a Glitch)
For decades, the US economy felt like a predictable, if sometimes temperamental, machine. We looked at the S&P 500, labor participation, and GDP, and we generally knew where we stood. But lately, with AI the gauges are spinning.
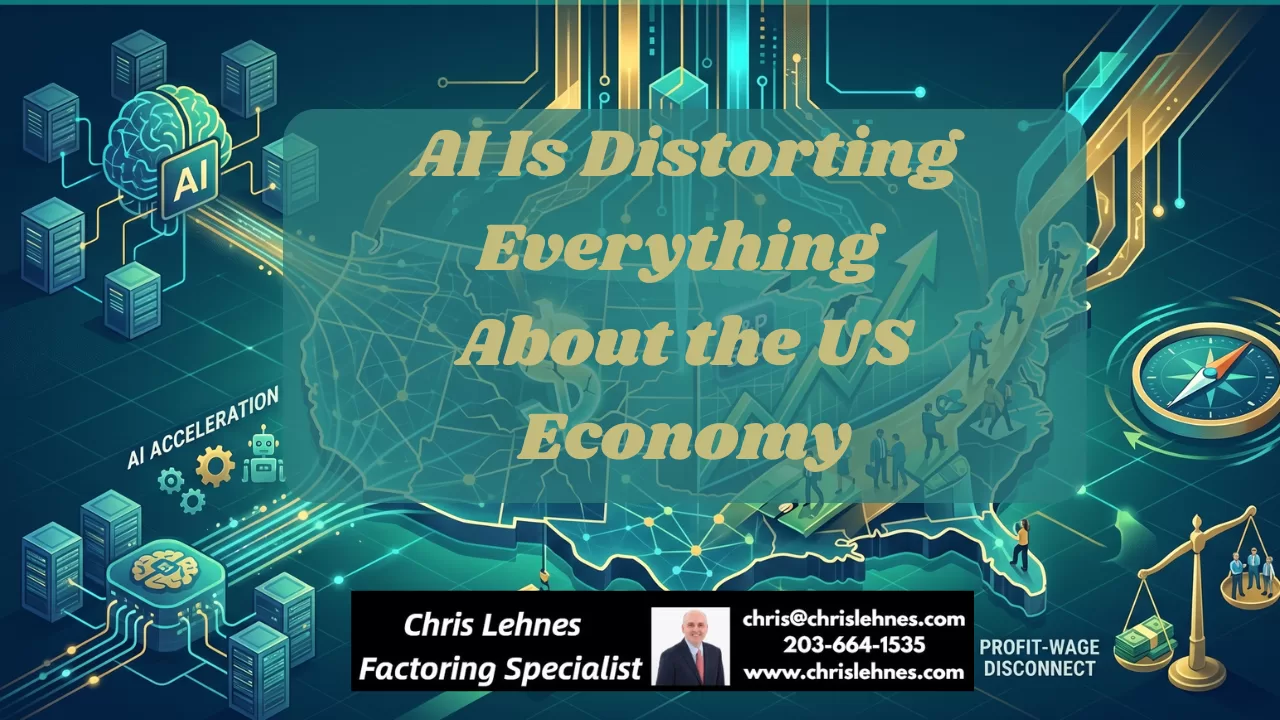
As we move through 2026, it’s becoming clear that Artificial Intelligence isn’t just another “sector” or a “tailwind.” It has become a massive, invisible force field distorting the very metrics we use to define economic health. From a soaring stock market that masks a stagnant middle class to a trade deficit driven by chips rather than cars, the “AI Distortion” is the new reality.
1. The Tale of Two Economies: AI vs. Everything Else
If you look at the surface-level GDP growth, things look great. But peel back the layers, and you’ll find a massive divergence.
Recent estimates suggest the “AI economy”—driven by massive capital expenditure from tech giants—is growing at a blistering pace of over 30%. Meanwhile, the rest of the traditional economy is barely treading water. We are seeing a “Hurricane-strength” weather system where a handful of companies (the “Magnificent 7” and their suppliers) are responsible for nearly all the growth, while sectors like housing, transportation, and traditional manufacturing face headwinds.
Key Stat: Morgan Stanley projects that capital spending by the five largest AI “hyperscalers” will top $1.1 trillion in 2027. To put that in perspective: that is more than the projected US national defense budget.
2. The Profit-Wage Disconnect
The most jarring distortion is the widening gap between corporate profits and worker pay. While S&P 500 earnings are rocketing—specifically for companies providing the “picks and shovels” of AI like NVIDIA—labor’s share of total business output has hit historic lows.
The Corporate Side: Profits are being driven by extreme efficiency and high-margin AI services.
The Human Side: Real wages, after inflation, have struggled to keep pace. Workers are feeling a “vibecesssion”—a psychological recession—even when the data says the economy is booming. The fear of replacement by AI is creating a mood of cautious pessimism that isn’t reflected in the soaring Nasdaq.
3. The Trade Deficit Illusion
Usually, a widening trade deficit is a sign of a weak domestic manufacturing base. In the Age of AI, it’s a sign of a domestic investment boom.
Because the US leads in AI software and design but relies on overseas foundries (primarily in Taiwan and South Korea) for high-end semiconductors, every dollar spent building a domestic data center often results in thousands of dollars of imported hardware. This is distorting our trade balance, making the US look “weaker” on paper even as it cements its role as the global hub for AI innovation.
4. Is It a Bubble or a Foundation?
The “B-word” is on everyone’s lips. Skeptics point to the 1990s dot-com era, noting that we are currently betting the entire economy on “scaling”—the idea that bigger models and more data will inevitably lead to AGI (Artificial General Intelligence).
If this bet pays off, we are building the infrastructure of a new civilization. If it doesn’t, the distortion could lead to a massive correction. We’ve reached a point where the US economy is “Too Big to Fail” on AI. As David Sacks, the administration’s AI czar, recently noted: a reversal in AI investment wouldn’t just be a tech correction—it would risk a full-scale national recession.
The Bottom Line
We are living in an era of synthetic growth. The numbers are real, but they don’t feel real to the average person because they are concentrated in a digital frontier. As AI continues to distort everything from job security to trade routes, the challenge for 2026 and beyond isn’t just “how to grow,” but how to ensure that the AI boom doesn’t leave the rest of the economy in its shadow.
The hand of the market is no longer just “invisible”—it’s becoming algorithmic.
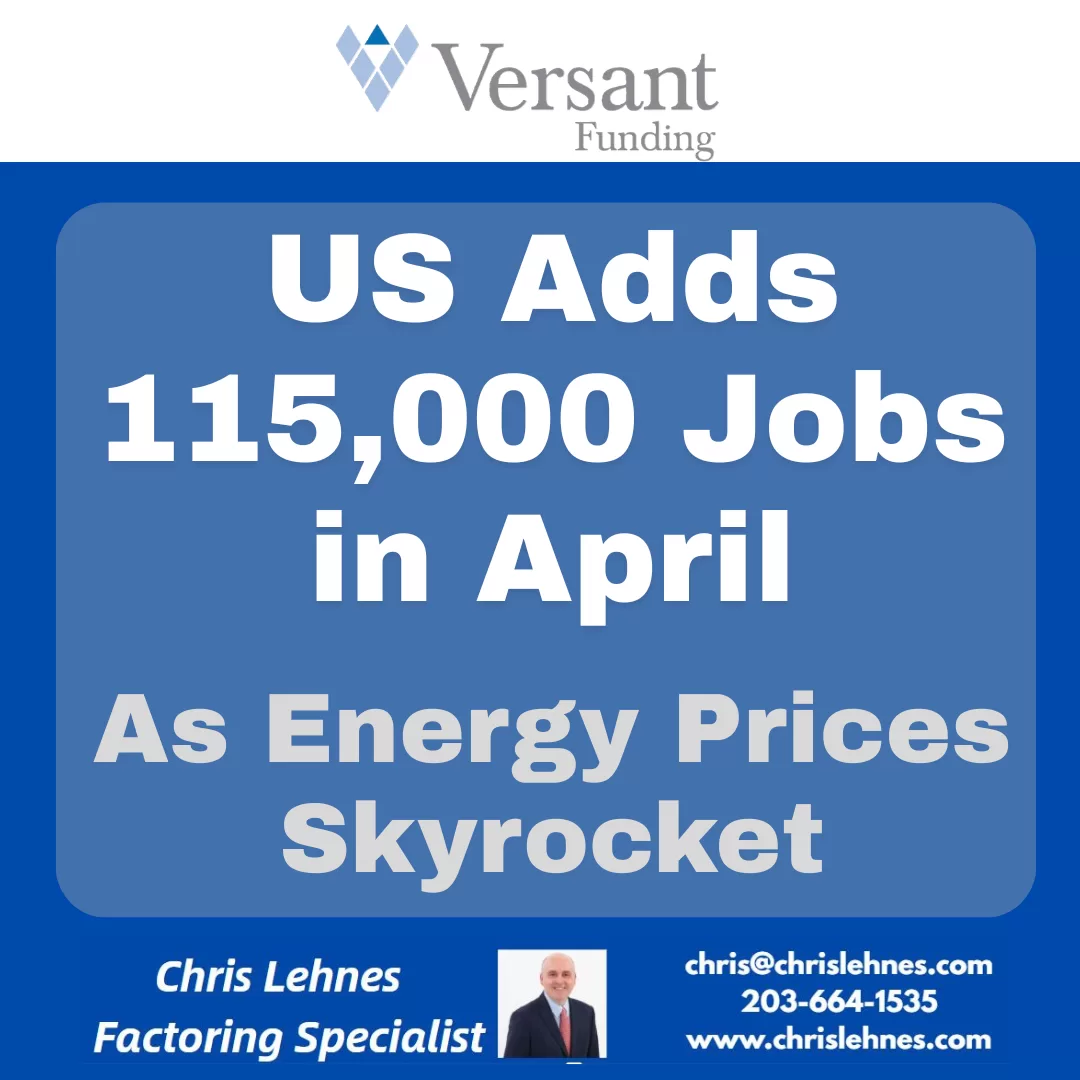
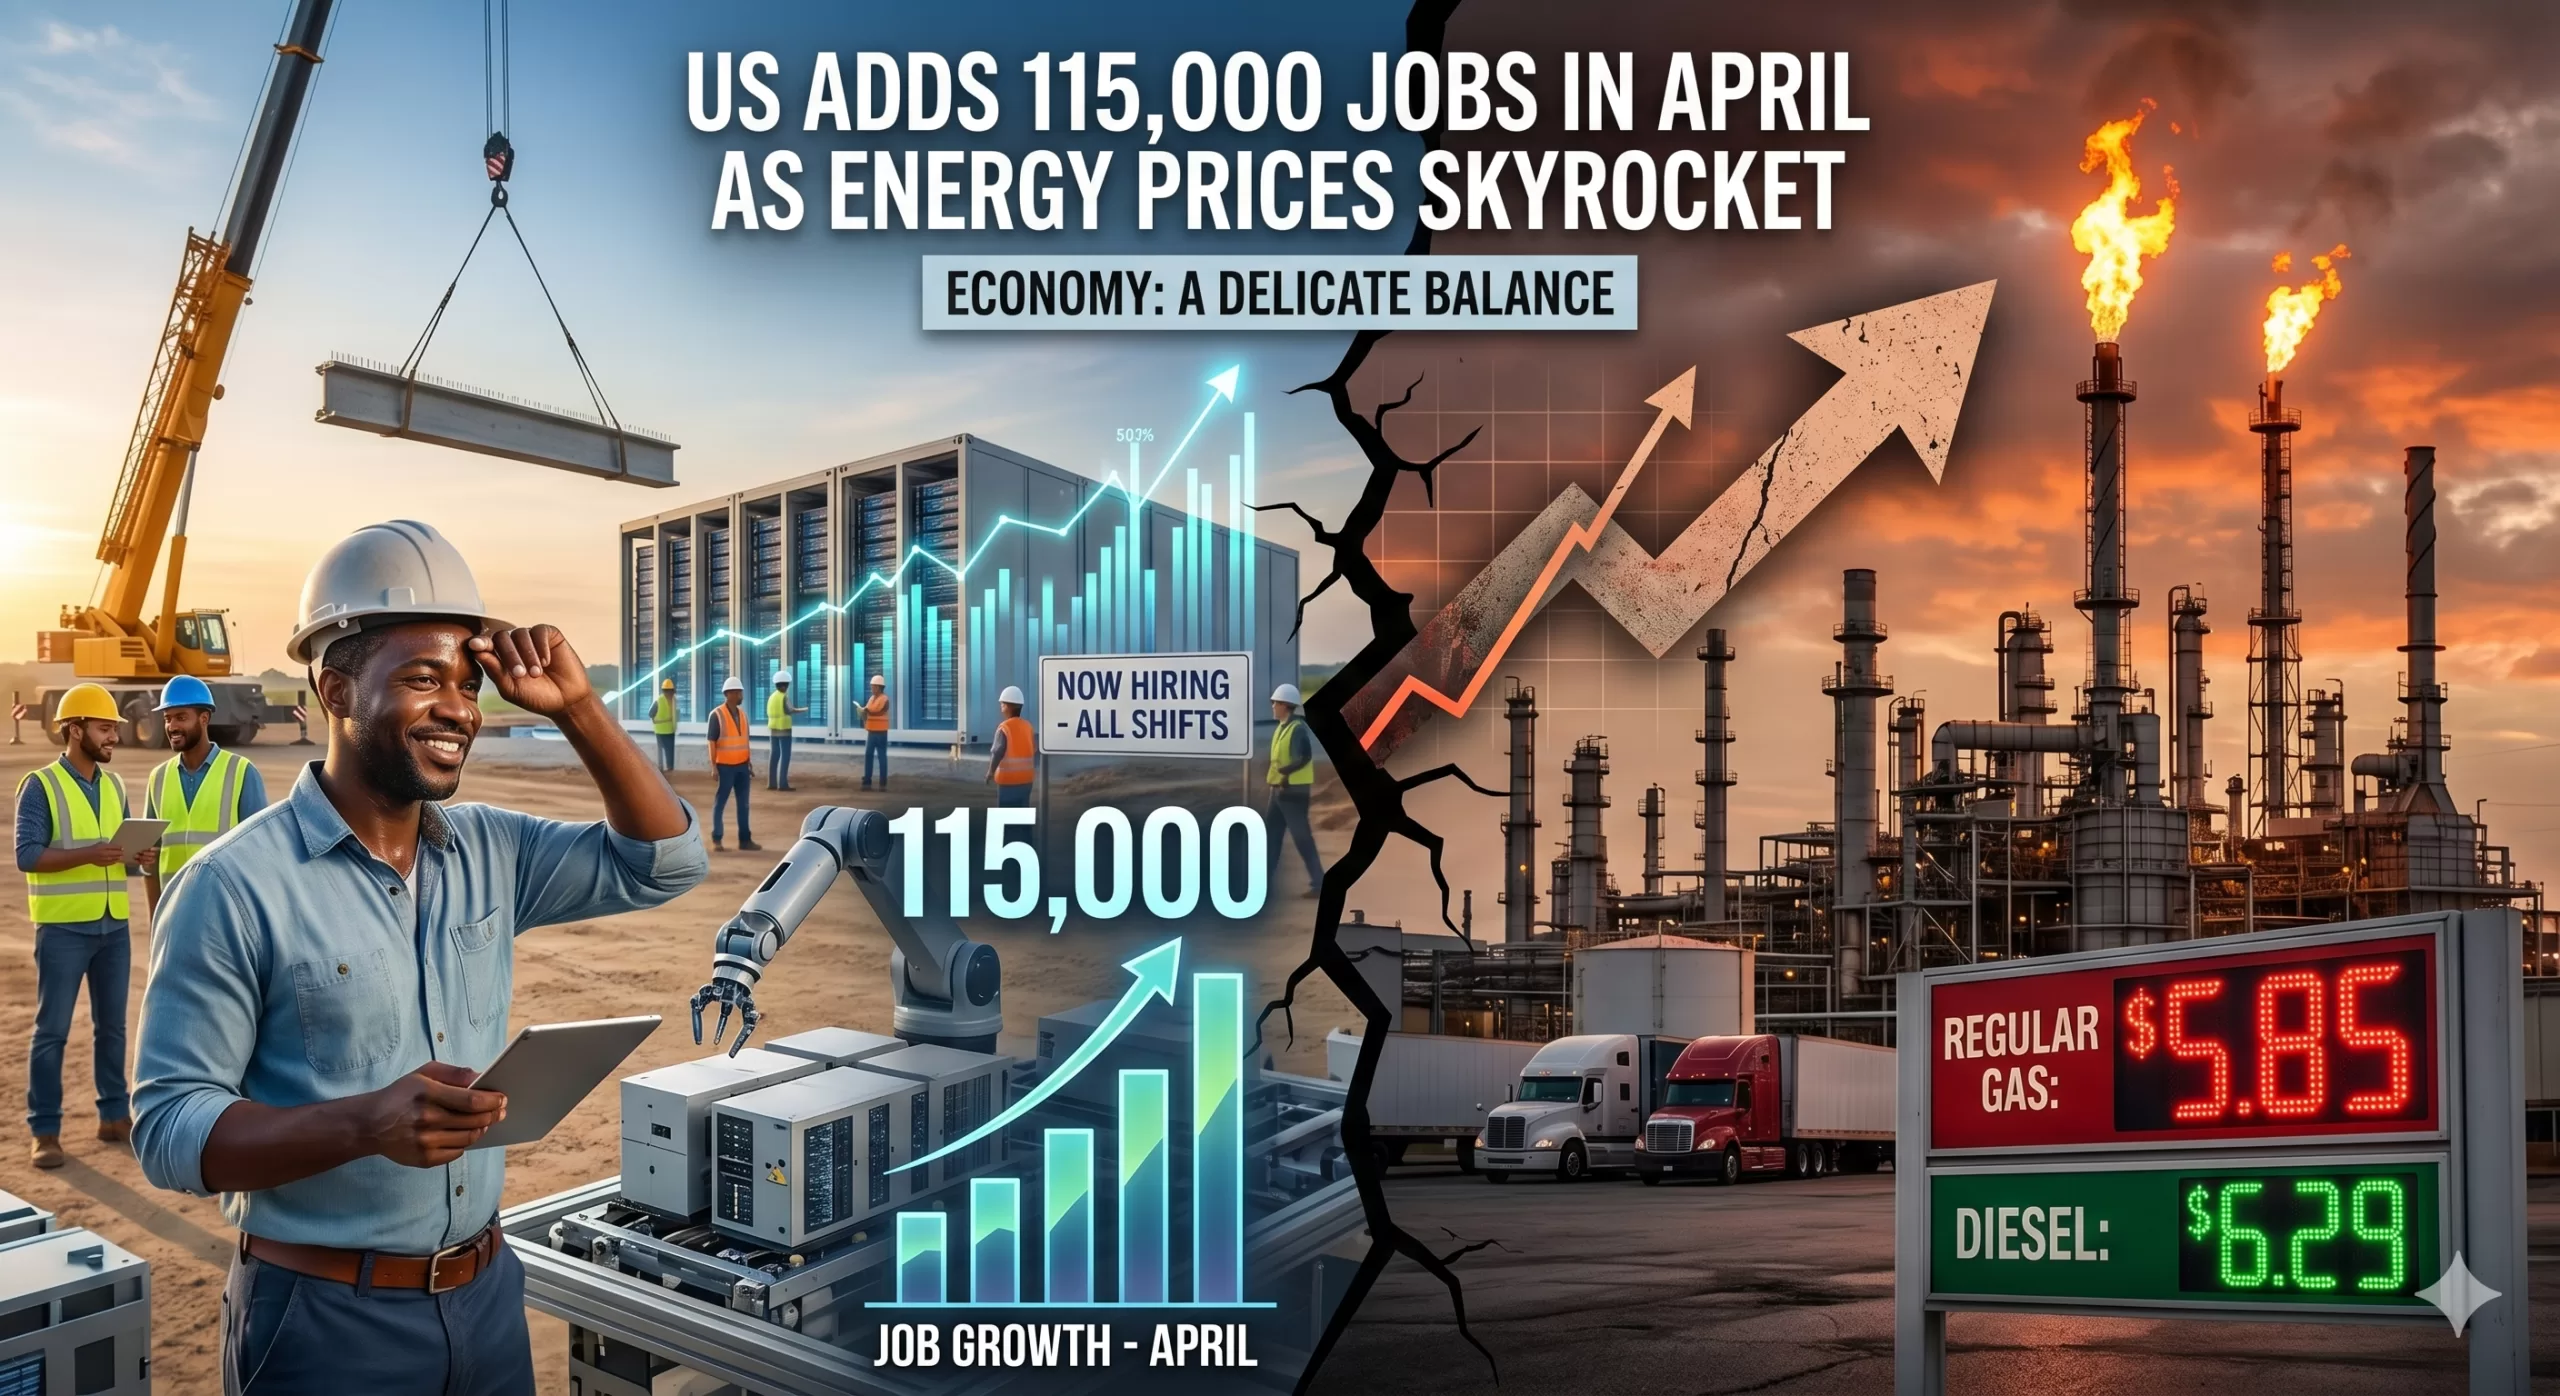
The latest Labor Department report released today, May 8, 2026, reveals a complex picture of the American economy. While the addition of 115,000 jobs in April far exceeded the conservative forecasts of 65,000, this hiring momentum is colliding with a volatile energy market and geopolitical tensions that are keeping consumers—and the Federal Reserve—on edge.
The April Jobs Numbers: A Surprising Resilience
Despite a year of uneven growth and high interest rates, the labor market continues to find its footing. The 115,000 gain marks a significant win for an economy that many feared was cooling too rapidly.
Unemployment Rate: Held steady at 4.3%, a remarkably low figure given the broader economic headwinds.
Sector Highlights: Growth was fueled by health services, education, and construction. Notably, the boom in AI data center construction is providing a sturdy floor for blue-collar employment.
Small Business Bounce: Much of the hiring surge came from small businesses (fewer than 20 employees), suggesting that local optimism remains resilient despite macro-level volatility.
The Energy Crisis: A Shadow Over the Recovery
While the job gains are a reason for celebration, they are being offset by a painful reality at the pump and in utility bills. Crude oil prices have breached the $100-per-barrel mark, driven largely by recent hostilities in the Strait of Hormuz.
For the average American household, the “energy tax” is real. Rising gas prices are eating into the gains from recent tax refunds and wage growth. This creates a “push-pull” dynamic:
The Push: Robust hiring and steady wages ($6.6\%$ growth for job-switchers) give consumers spending power.
The Pull: Skyrocketing energy costs increase the cost of goods and transportation, effectively neutralizing those wage gains for many families.
What This Means for the Federal Reserve
The Fed is now in a delicate position. Usually, a strong jobs report would signal that the economy can handle higher interest rates. However, with energy prices driving “cost-push” inflation, Fed Chair Jerome Powell and his team must decide if the labor market is stable enough to wait out the energy spike or if they need to pivot to protect growth.
Traders are currently betting on a “stable backdrop,” but the volatility in the Middle East remains the ultimate wildcard. If energy prices continue their upward trajectory, the modest 115,000-job gain might be harder to replicate in May.
Looking Ahead
The April report proves that the U.S. economy is more durable than skeptics predicted, but it also highlights our vulnerability to global supply shocks. As we move into the summer months, all eyes will be on two things: the price of a gallon of gas and whether the AI-driven infrastructure boom can continue to carry the weight of the labor market.
Bottom Line: The American worker is still in demand, but the cost of living—fueled by a chaotic energy market—is the primary threat to this hard-won stability.
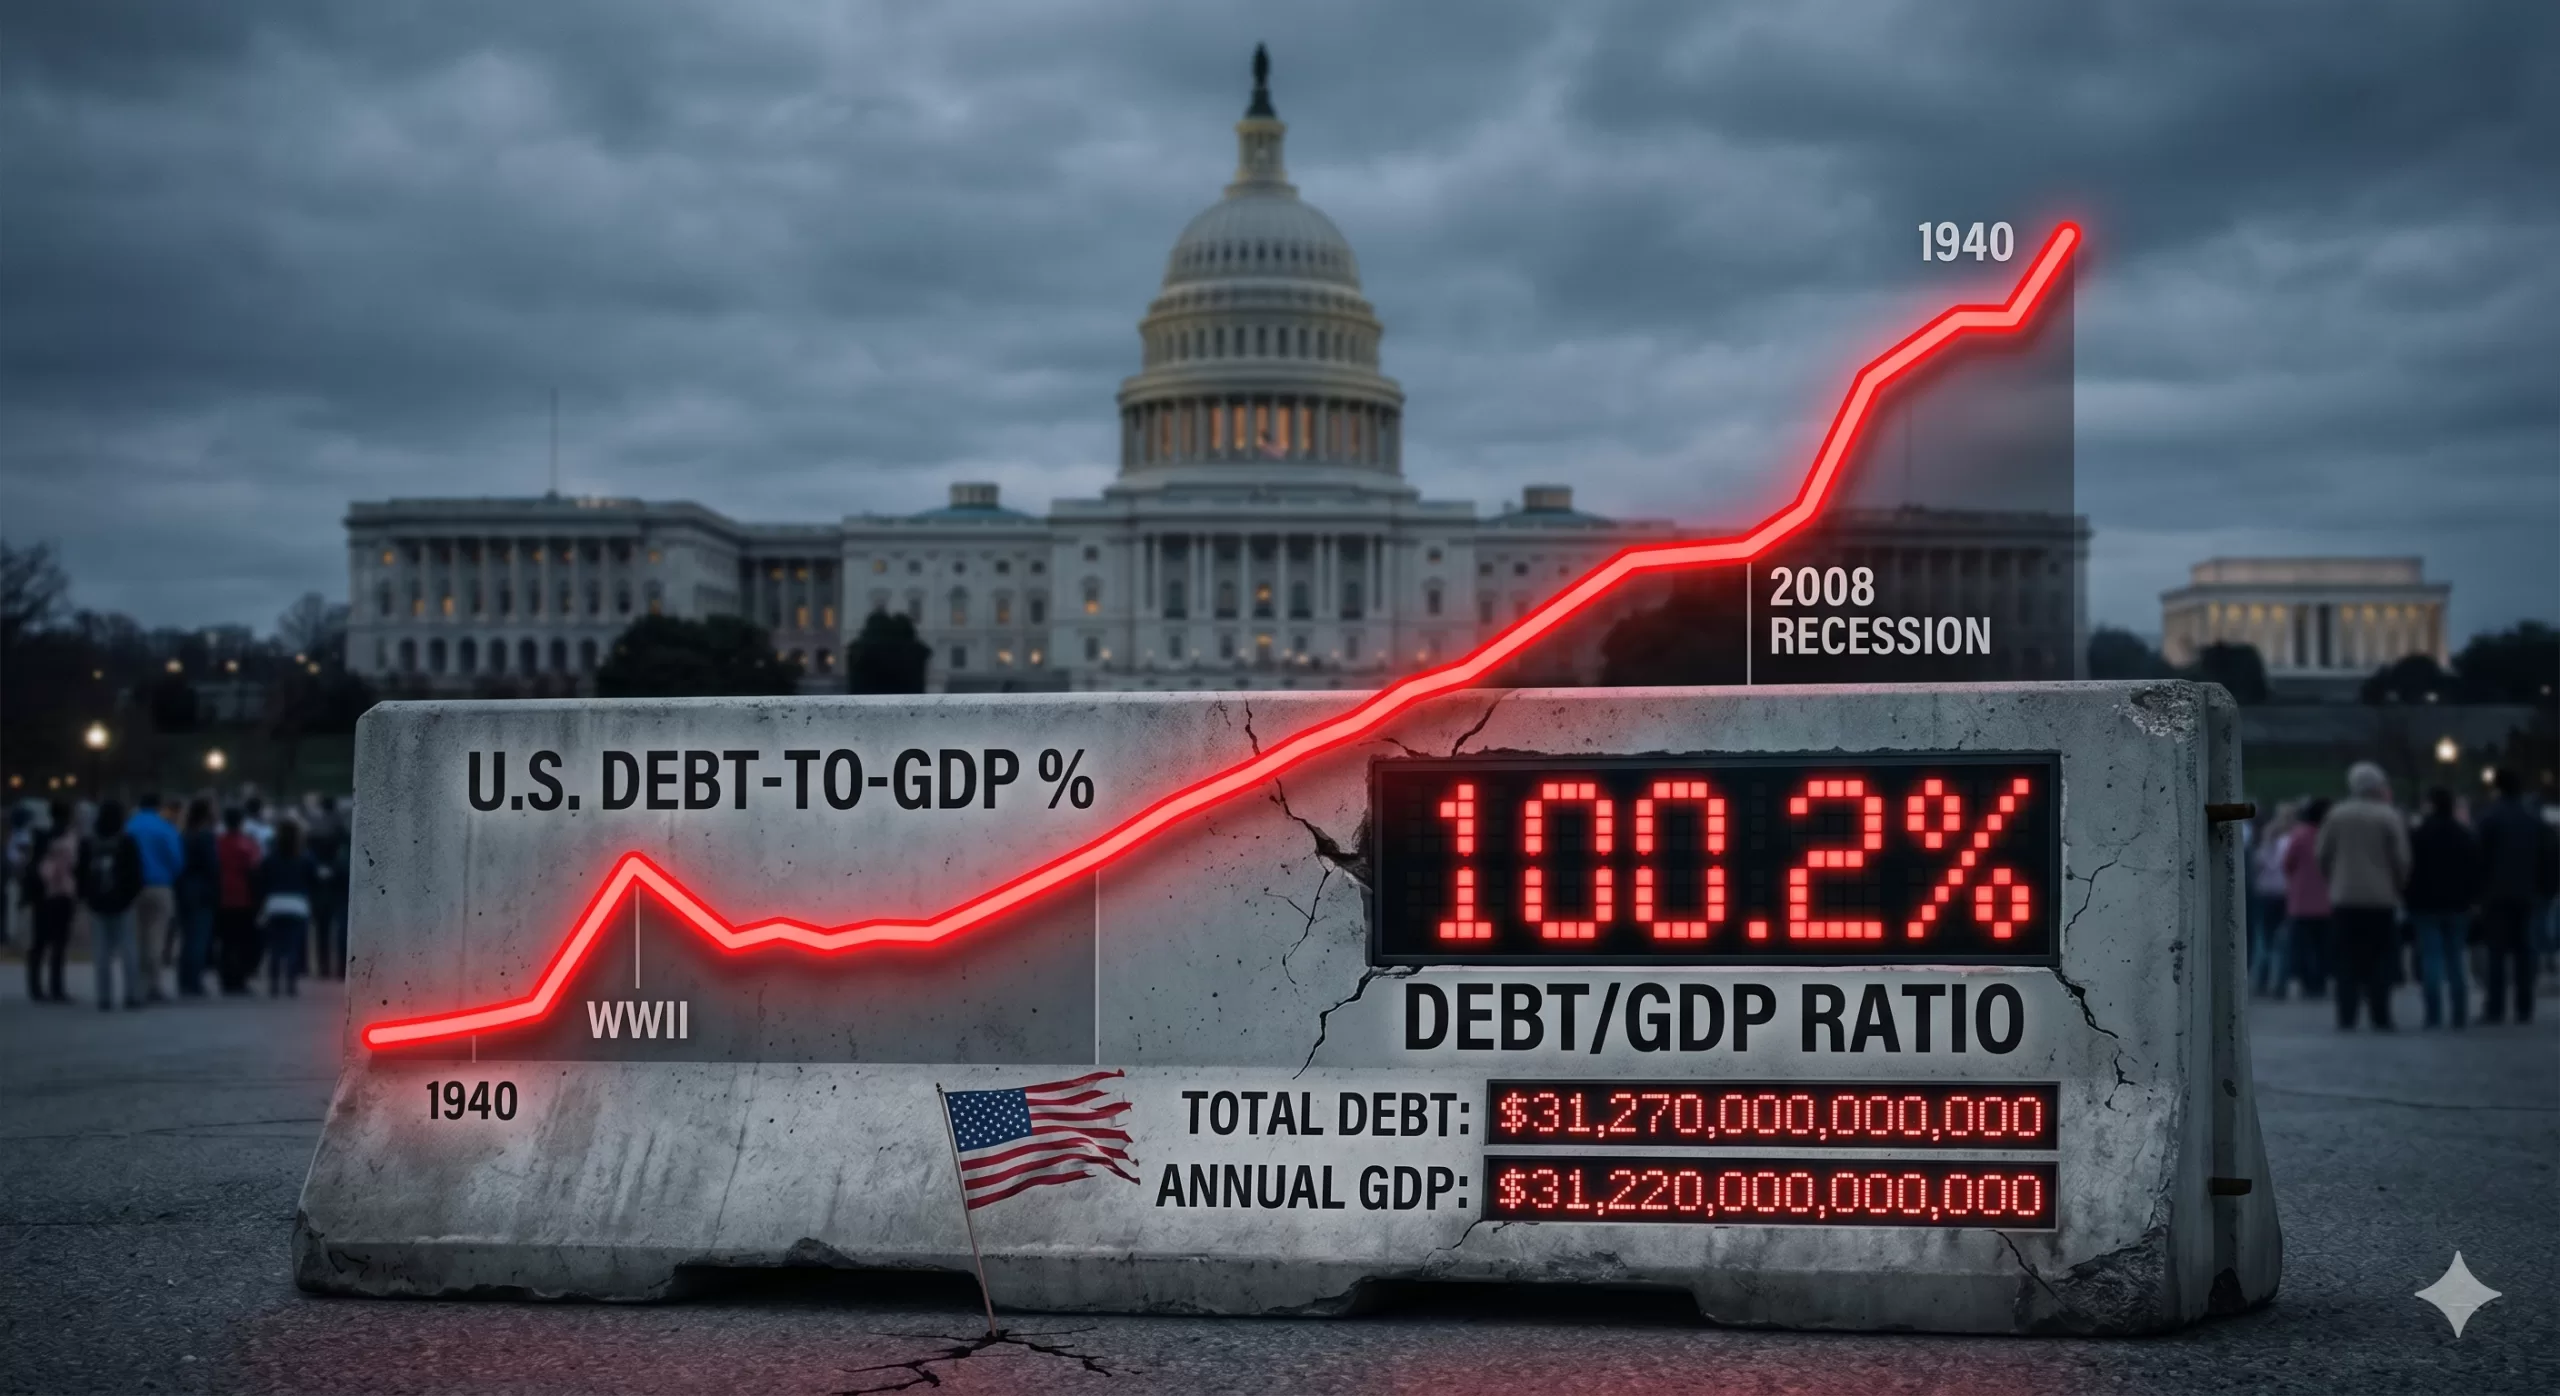
For the first time since the aftermath of World War II, the United States has reached a fiscal milestone that was once a distant “what-if” scenario: the national debt has officially surpassed 100% of the country’s Gross Domestic Product (GDP).
As of March 31, 2026, the debt held by the public reached $31.27 trillion, while the total annual economic output sat at $31.22 trillion. In simple terms, we now owe more as a nation than we produce in an entire year.
While “trillions” can feel like abstract Monopoly money, this 100.2% ratio represents a fundamental shift in the American economic landscape. Here is what you need to know about why this happened and what it means for the future.
How Did We Get Here?
This wasn’t an overnight accident. It is the result of decades of “fiscal kicking the can.” The surge to 100% was fueled by three primary engines:
Structural Deficits: For years, the government has spent roughly $1.33 for every $1.00 it collects in revenue.
The Interest Trap: As the total debt grows, so do the interest payments. In 2026, the U.S. is projected to spend approximately $1 trillion on interest alone—surpassing the entire national defense budget.
Demographic Shifts: An aging population is naturally drawing more heavily on Social Security and Medicare, programs that make up a massive portion of mandatory spending.
Why the 100% Threshold Matters
Economists often debate whether there is a “magic number” where debt becomes fatal. While 100% isn’t an immediate “cliff,” it serves as a critical psychological and economic warning light for several reasons:
Slower Economic Growth: Historical data suggests that when a nation’s debt exceeds 90% of GDP, average annual growth tends to slow. Resources that could be used for private investment or infrastructure are instead diverted to servicing old debt.
Reduced “Crisis Cushion”: When the next pandemic, recession, or war hits, the government has less “dry powder” to respond. Borrowing your way out of a crisis is much harder when your credit card is already maxed out relative to your income.
Generational Equity: The debt essentially represents a “tax” on future generations. Today’s spending is being financed by the earnings of Americans who haven’t even entered the workforce yet.
The Cost to the Average Household
To bring these massive numbers down to earth, the Senate Joint Economic Committee’s April 2026 update provides a sobering breakdown:
Debt per Person: Approximately $114,000
Debt per Household: Approximately $289,000
Is There a Way Out?
The U.S. has been here before. After 1945, the debt-to-GDP ratio was successfully whittled down to 34% by 1980. However, that was achieved through a unique combination of post-war industrial dominance, a massive “Baby Boom” workforce, and rapid GDP growth.
Today, the path is narrower. Solutions generally fall into three difficult categories:
Entitlement Reform: Adjusting Social Security and Medicare to match modern life expectancies.
Revenue Increases: Raising taxes or closing loopholes to narrow the deficit.
Growth Incentives: Policies designed to make the “GDP” side of the ratio grow faster than the “Debt” side.
The Bottom Line
Crossing the 100% threshold is a “reckoning” moment. It signals that the era of “cheap” borrowing is over. As interest payments continue to eat a larger slice of the federal pie, the pressure on the American taxpayer—and the pressure to make hard political choices—will only intensify.
The red line has been crossed. The question now is whether we have the political will to head back toward the black.