Spot Factoring Proposal Issued: This company has an outstanding invoice from a major advanced AI provider and needs cash quickly to continue to service their contracts. Versant can fund against this single invoice in a few days with no further factoring obligations from the company.
Impact of Iran War Ripple through the Economy Due to Gas Prices
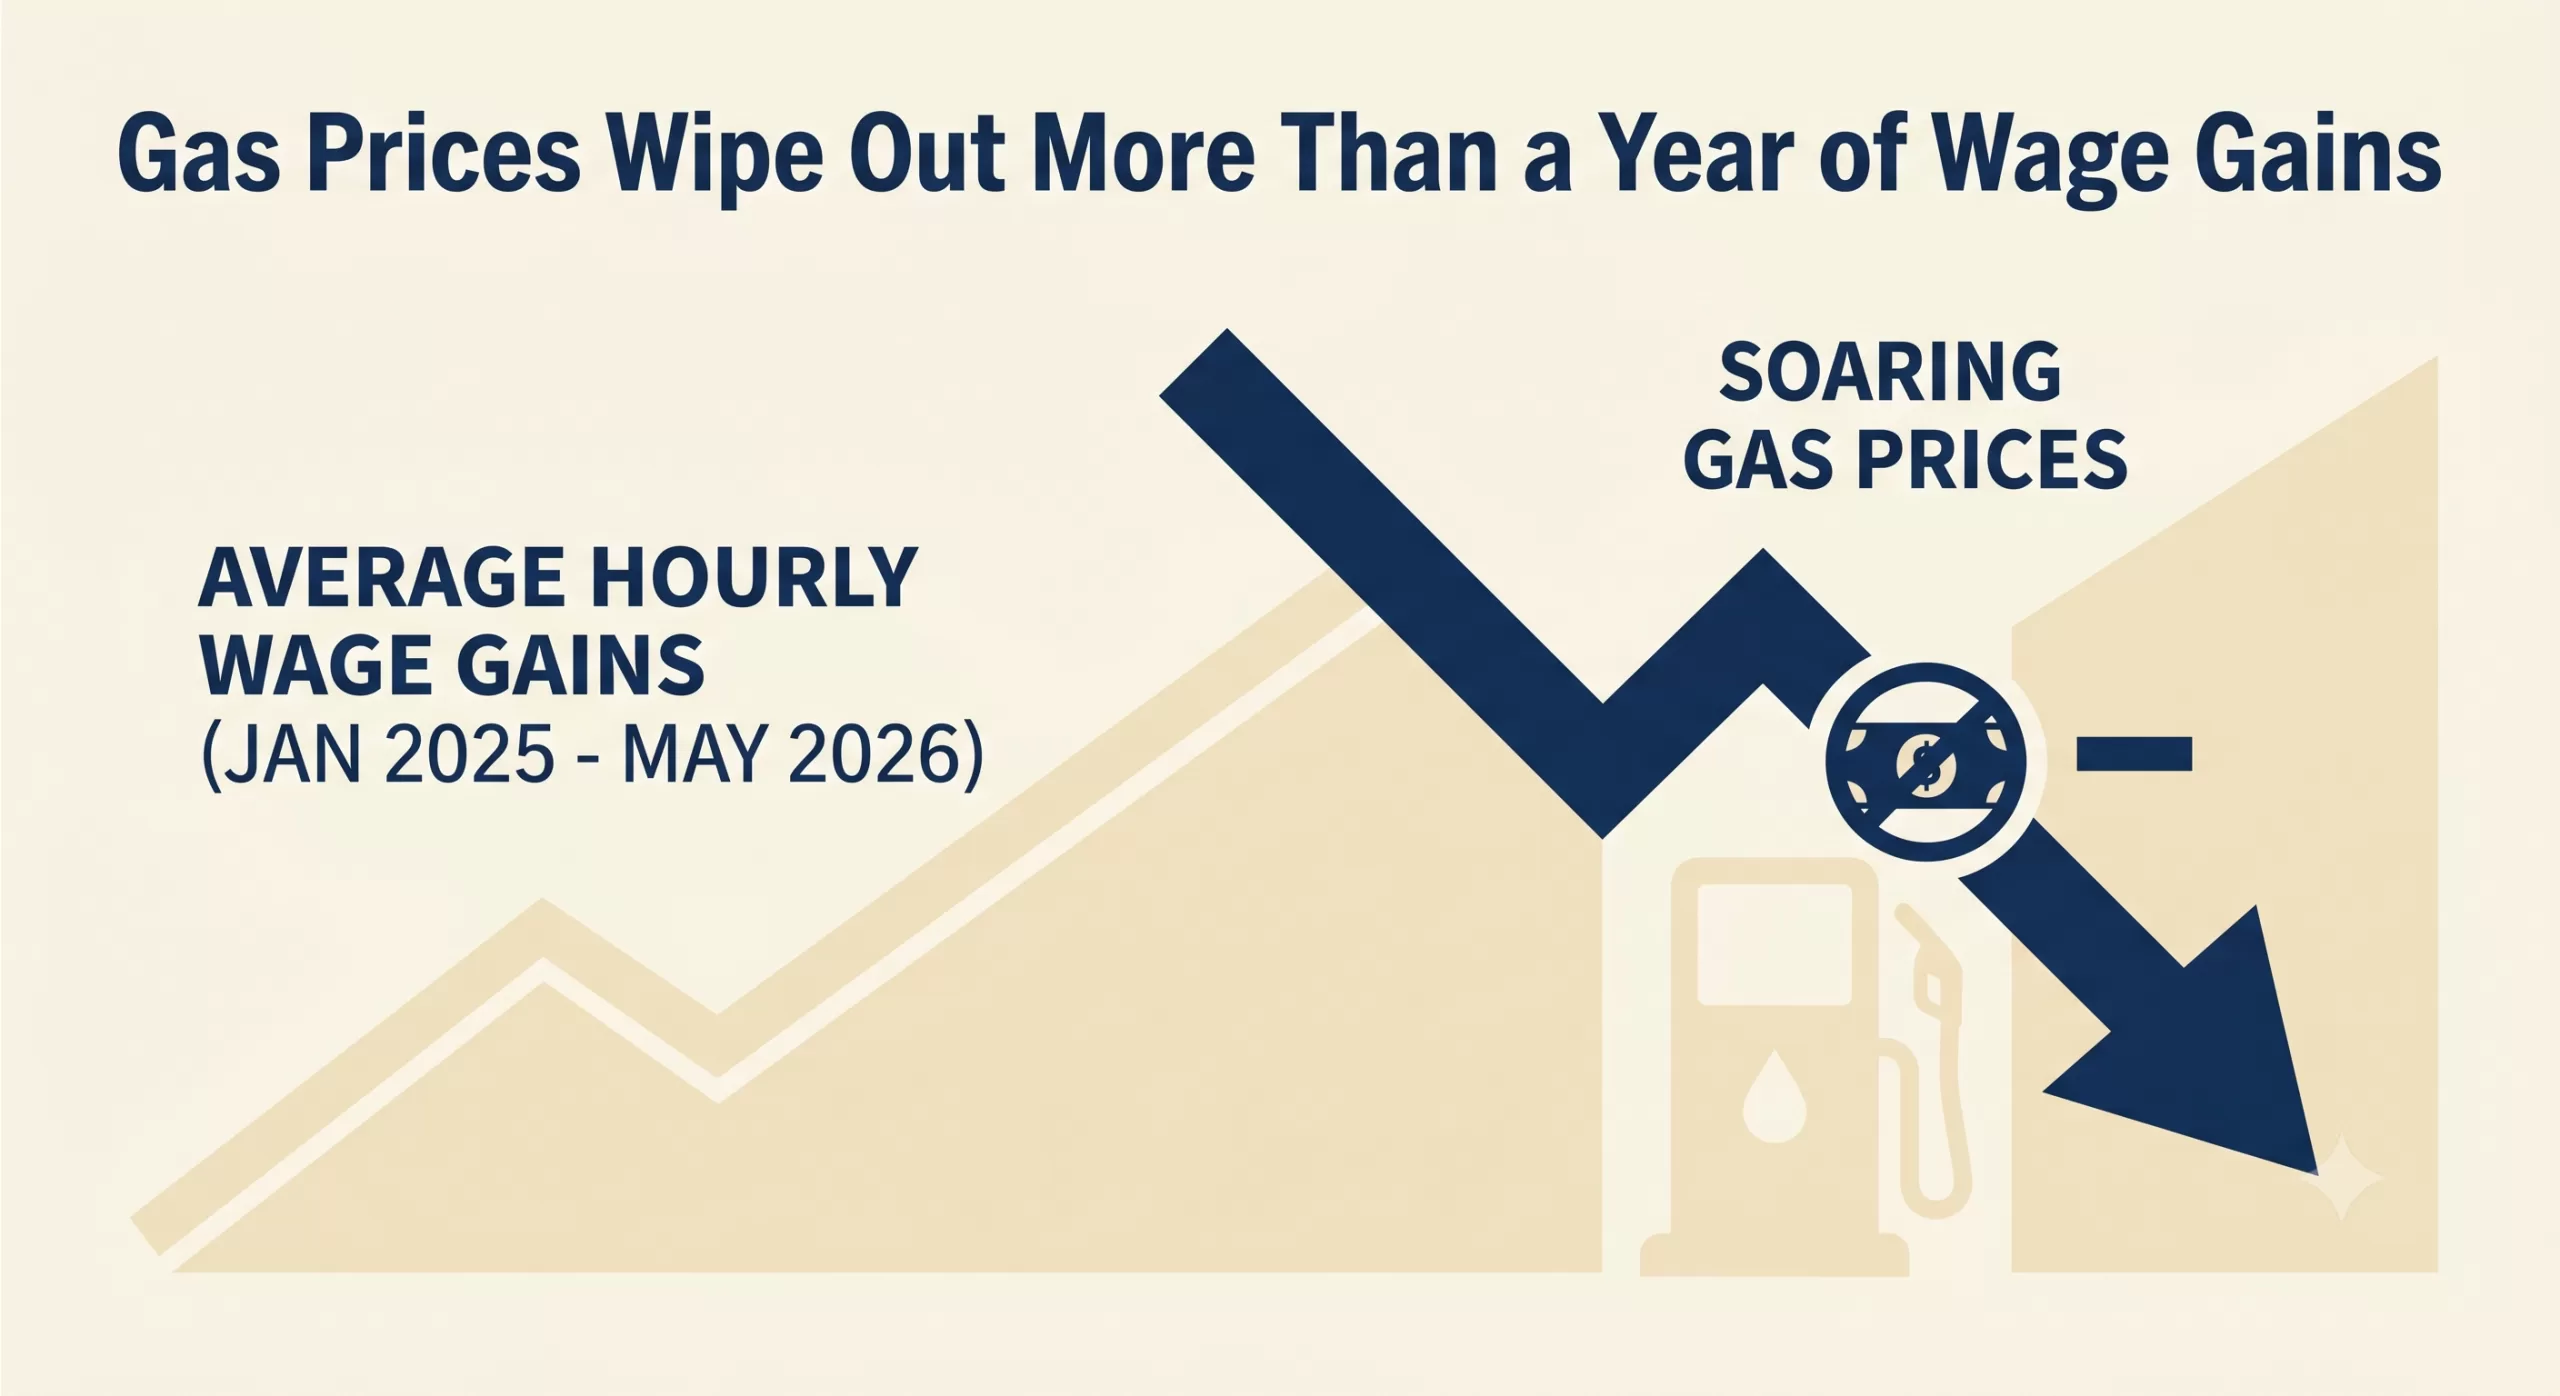
The latest macroeconomic indicators including gas prices paint a challenging picture for both consumers and businesses. Following the Labor Department‘s recent reports, it is clear that soaring energy costs have effectively neutralized recent progress in worker compensation. With top-line inflation advancing to 4.2% in May—the highest level in three years—and gasoline prices surging, real average hourly earnings have been pushed all the way back to January 2025 levels.
For the second consecutive month, inflation has outpaced wage growth. The reality is that gas prices have wiped out more than a year of wage gains.
The Macroeconomic Squeeze
The ripple effects of this inflationary spike are significant. The Federal Reserve now faces a complex policy dilemma as they weigh interest rate decisions against a backdrop of stubborn inflation and squeezed household budgets. When wages lag behind inflation, consumer spending inevitably cools, particularly among middle- and lower-income brackets who are forced to allocate a larger share of their take-home pay to essentials like fuel and groceries.
What This Means for Business Owners
While the headlines focus on the consumer at the pump, small and mid-sized businesses are absorbing these shocks on multiple fronts:
Increased Operational Costs: Surging fuel prices directly inflate the cost of transportation, logistics, and supply chain operations.
Margin Compression: Businesses face the difficult choice of passing higher costs onto increasingly price-sensitive consumers or absorbing the losses and shrinking their profit margins.
Wage Pressure: Even though real wages are falling, nominal wage demands remain high as employees seek relief from the rising cost of living, straining payroll budgets.
Navigating the Cash Flow Crunch
During periods of high inflation and uncertain interest rates, liquidity becomes a paramount concern. Industries heavily reliant on steady cash flow—such as manufacturing, staffing, healthcare, and distribution—can find their working capital severely constrained when expenses rise faster than revenues can be collected.
Waiting 30, 60, or 90 days for clients to pay outstanding invoices is a luxury many companies cannot afford when the cost of doing business is escalating weekly. Accounts receivable factoring offers a strategic mechanism to bridge this gap. By converting outstanding B2B invoices into immediate working capital, business owners can cover rising operational costs, meet payroll obligations, and navigate economic volatility without taking on new debt or waiting on unpredictable macroeconomic shifts.
As we continue to monitor the inflation data and the Fed’s next moves, maintaining robust working capital will be the defining factor for businesses looking to weather this storm.
If you’ve been keeping an eye on the economic headlines lately, you might have braced yourself for a sluggish jobs report this May. With rising inflation and the economic ripple effects of the ongoing conflict in Iran, many analysts were predicting a significant cooldown in hiring.
But the U.S. labor market just threw a massive curveball.
Here is a breakdown of the May 2026 jobs report, what the numbers actually mean, and why the American economy continues to show surprising resilience.
The Headline Numbers: Blowing Past Estimates
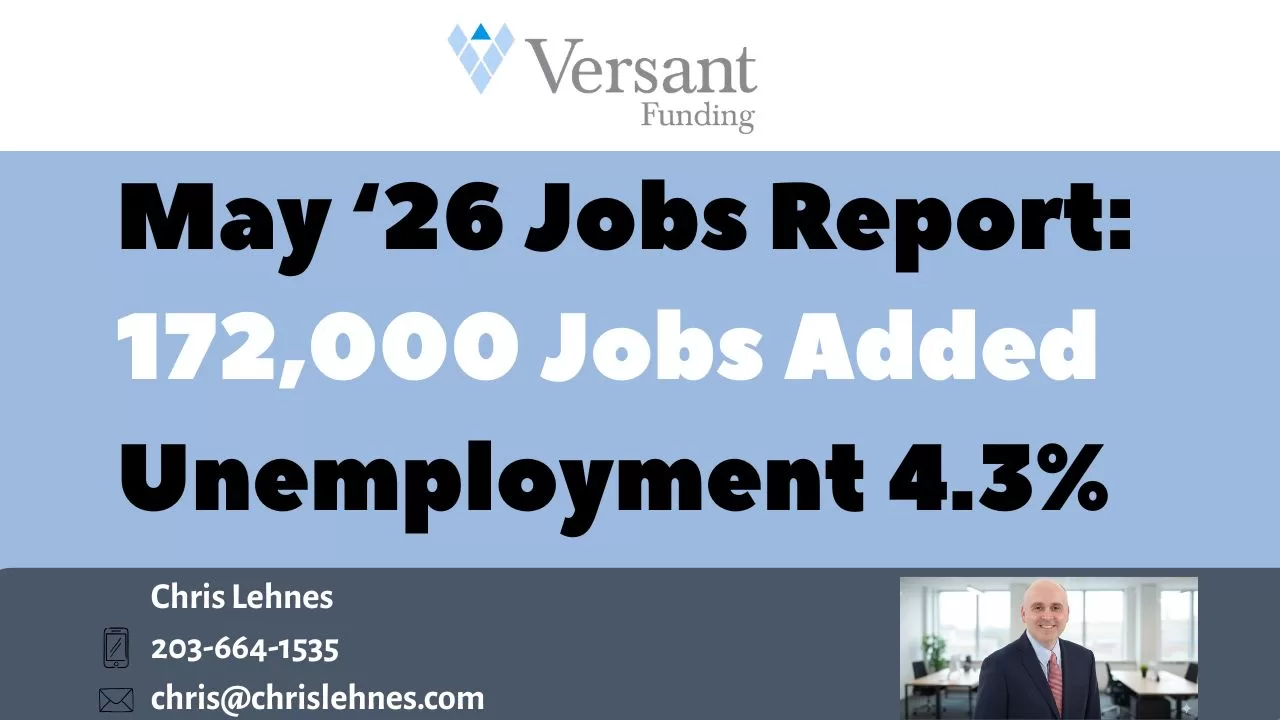
Economists were largely projecting a modest gain of around 85,000 jobs for May. Instead, the Labor Department revealed that U.S. employers added a robust 172,000 new jobs.
Total Jobs Added: 172,000 (vs. 85,000 expected)
Unemployment Rate: Held steady at 4.3%
Wage Growth: Average hourly earnings ticked up by 0.3% month-over-month.
April Revisions: April’s numbers were also sharply revised upward from 115,000 to an impressive 179,000.
This wasn’t just a slight beat; it was a doubling of expectations, indicating that businesses are still finding reasons to hire and expand, even in an uncertain macroeconomic climate.
Where Are the Jobs Coming From?
While the headline number is strong, the growth wasn’t entirely uniform across the board. The heavy lifting was done by a few key sectors:
Healthcare and Social Services: Continuing a long-running trend, healthcare remains a massive engine for job creation, accounting for a significant chunk of the new roles.
Leisure and Hospitality: As the weather warms up, consumer demand for travel and dining out remains steady, prompting strong hiring in this sector.
Local Government: Public sector hiring also saw notable gains.
Conversely, some sectors felt the pinch. Employment in financial activities slipped slightly, reflecting tighter borrowing conditions and shifting corporate strategies.
Resilience Amid Global Headwinds
The most fascinating takeaway from this report isn’t just the sheer number of jobs added—it’s the context in which they were created.
Since the escalation of the war in Iran earlier this year, global energy markets have been incredibly volatile. Spiking oil prices have renewed fears of inflation, putting pressure on consumer wallets and business operational costs alike. Despite these immense headwinds, the domestic labor market has absorbed the shock remarkably well.
The fact that employers are still confident enough to add 172,000 workers to their payrolls suggests an underlying structural strength in the U.S. economy that is, for now, overriding geopolitical anxieties.
What This Means for the Federal Reserve
Of course, a hot jobs report complicates things for the Federal Reserve.
When the labor market is strong and wage growth is steady, inflation tends to remain sticky. Prior to this report, there was speculation that the Fed might keep interest rates flat for the rest of the year. However, this display of economic resilience might push policymakers in a more hawkish direction. While the steady 4.3% unemployment rate means the labor market isn’t overheating, markets are now bracing for the possibility that the Fed could lift rates at least once by the end of 2026 to keep inflationary pressures in check.
The Bottom Line
The May 2026 jobs report is a potent reminder that the U.S. economy rarely behaves exactly as modeled. While the challenges of inflation and global conflict are very real, the underlying demand for labor remains undeniably robust. Whether this momentum can be sustained into the summer remains to be seen, but for now, the job market continues to defy the odds.
A strategy change at their current factoring company left this rapidly-growing frozen snack business scrambling to find a new funding source. Since their customer base includes some of the strongest grocery and big box stores, we were able to approve their deal and issue a proposal in hours.
Defrosting Your Working Capital: Navigating Cash Flow Challenges in the Frozen Snack Business
The frozen snack sector—whether you’re manufacturing premium frozen pizzas, artisanal ice creams, or grab-and-go appetizers—is a dynamic and growing market. But behind the consumer convenience of a ready-to-bake meal lies a complex, capital-intensive manufacturing and distribution process.
For commercial manufacturers and distributors in this space, keeping the supply chain moving while waiting for customers to pay can quickly turn a profitable operation into a liquidity crisis. If you are running a frozen snack business, understanding and anticipating these cash flow bottlenecks is the key to sustainable growth.
Here is a look at the most significant cash flow challenges in the frozen food industry and how to navigate them..
Unlike shelf-stable goods, frozen snacks require a continuous, unbroken chain of temperature-controlled environments. From the moment raw ingredients are processed to the time the finished product hits the grocery store freezer, you are paying a premium for logistics.
High Overhead: Specialized refrigerated warehousing and refrigerated freight transportation (reefers) are exceptionally expensive and subject to sudden fuel price fluctuations.
Commodity and Tariff Volatility: The cost of raw ingredients—from the dairy in your cheese to the wheat in your crusts—can swing wildly based on macroeconomic trends, global trade policies, and tariffs. When raw material costs spike unexpectedly, your margins compress, and your available cash drops before you can even adjust your retail pricing.
2. The Trap of Extended Retail Payment Terms
Perhaps the single biggest cash flow killer for food manufacturers is the gap between when you pay your suppliers and when your buyers pay you.
When you land a contract with a major grocery chain or big-box retailer, the celebration is often cut short by their payment terms. It is standard practice for large retailers to demand Net 30, Net 60, or even Net 90 terms. Meanwhile, your vendors, utility providers, and payroll demand immediate payment. This creates a massive working capital gap. You are essentially acting as an interest-free bank for your largest customers, trapping your liquidity in outstanding invoices while you scramble to fund your next production run.
3. Retailer Distress and Bankruptcy Risks
The retail landscape is volatile. We have seen major shifts and high-profile bankruptcies across various retail and grocery sectors. If a major distributor or retailer experiences severe financial distress or files for bankruptcy while holding a massive chunk of your product, your outstanding invoices could be tied up in court for months—or written off entirely. Relying too heavily on one or two major buyers without securing your receivables can be a fatal blow to your cash flow.
While freezing extends shelf life, it doesn’t make inventory immortal. Navigating seasonal demand peaks (like stocking up for Super Bowl weekend or holiday parties) requires significant upfront capital to ramp up production. Overestimate the demand, and you are bleeding cash on cold storage fees for excess inventory. Underestimate it, and you miss out on critical revenue.
Bridging the Gap: Finding Liquidity
When your cash is frozen in accounts receivable, taking on traditional bank debt isn’t always the fastest or most strategic answer—especially if your balance sheet is already highly leveraged.
Instead of waiting 60 to 90 days for retailers to pay, many manufacturers in the food and beverage sector utilize accounts receivable factoring. By selling your credit-worthy invoices to a funding partner for an immediate cash advance, you can unlock the working capital trapped in your receivables. This allows you to:
Meet payroll and cover cold-storage overhead without stress.
Take advantage of early-payment discounts from your raw ingredient suppliers.
Ramp up production to fulfill massive purchase orders from new distributors.
Running a frozen snack business means managing incredibly tight logistical tolerances. Your financing strategy needs to be just as reliable. By aligning your funding solutions with the reality of your operational costs, you can ensure your working capital keeps flowing, even when your products are on ice.
The Invisible Hand is Getting a Digital Upgrade (and a Glitch)
For decades, the US economy felt like a predictable, if sometimes temperamental, machine. We looked at the S&P 500, labor participation, and GDP, and we generally knew where we stood. But lately, with AI the gauges are spinning.
As we move through 2026, it’s becoming clear that Artificial Intelligence isn’t just another “sector” or a “tailwind.” It has become a massive, invisible force field distorting the very metrics we use to define economic health. From a soaring stock market that masks a stagnant middle class to a trade deficit driven by chips rather than cars, the “AI Distortion” is the new reality.
1. The Tale of Two Economies: AI vs. Everything Else
If you look at the surface-level GDP growth, things look great. But peel back the layers, and you’ll find a massive divergence.
Recent estimates suggest the “AI economy”—driven by massive capital expenditure from tech giants—is growing at a blistering pace of over 30%. Meanwhile, the rest of the traditional economy is barely treading water. We are seeing a “Hurricane-strength” weather system where a handful of companies (the “Magnificent 7” and their suppliers) are responsible for nearly all the growth, while sectors like housing, transportation, and traditional manufacturing face headwinds.
Key Stat: Morgan Stanley projects that capital spending by the five largest AI “hyperscalers” will top $1.1 trillion in 2027. To put that in perspective: that is more than the projected US national defense budget.
2. The Profit-Wage Disconnect
The most jarring distortion is the widening gap between corporate profits and worker pay. While S&P 500 earnings are rocketing—specifically for companies providing the “picks and shovels” of AI like NVIDIA—labor’s share of total business output has hit historic lows.
The Corporate Side: Profits are being driven by extreme efficiency and high-margin AI services.
The Human Side: Real wages, after inflation, have struggled to keep pace. Workers are feeling a “vibecesssion”—a psychological recession—even when the data says the economy is booming. The fear of replacement by AI is creating a mood of cautious pessimism that isn’t reflected in the soaring Nasdaq.
3. The Trade Deficit Illusion
Usually, a widening trade deficit is a sign of a weak domestic manufacturing base. In the Age of AI, it’s a sign of a domestic investment boom.
Because the US leads in AI software and design but relies on overseas foundries (primarily in Taiwan and South Korea) for high-end semiconductors, every dollar spent building a domestic data center often results in thousands of dollars of imported hardware. This is distorting our trade balance, making the US look “weaker” on paper even as it cements its role as the global hub for AI innovation.
4. Is It a Bubble or a Foundation?
The “B-word” is on everyone’s lips. Skeptics point to the 1990s dot-com era, noting that we are currently betting the entire economy on “scaling”—the idea that bigger models and more data will inevitably lead to AGI (Artificial General Intelligence).
If this bet pays off, we are building the infrastructure of a new civilization. If it doesn’t, the distortion could lead to a massive correction. We’ve reached a point where the US economy is “Too Big to Fail” on AI. As David Sacks, the administration’s AI czar, recently noted: a reversal in AI investment wouldn’t just be a tech correction—it would risk a full-scale national recession.
The Bottom Line
We are living in an era of synthetic growth. The numbers are real, but they don’t feel real to the average person because they are concentrated in a digital frontier. As AI continues to distort everything from job security to trade routes, the challenge for 2026 and beyond isn’t just “how to grow,” but how to ensure that the AI boom doesn’t leave the rest of the economy in its shadow.
The hand of the market is no longer just “invisible”—it’s becoming algorithmic.
Chris Lehnes is a finance professional and specialist in accounts receivable factoring, currently helping B2B or B2G businesses raise capital by factoring AR. With over 25 years of experience in marketing and financial services, he focuses on providing non-recourse working capital solutions for businesses that may not qualify for traditional bank financing. [1, 2, 3, 4]
Professional Expertise
Lehnes operates primarily as an educator and intermediary in the factoring industry, helping companies bridge cash flow gaps through their receivables. His expertise includes: [1, 2]
Target Industries: He provides funding for a variety of sectors including energy, healthcare, manufacturing, and staffing.
Specialized Funding: He specializes in “challenging deals,” such as startups, companies with high customer concentrations, or those with weak personal credit.
Financial Content: Lehnes is a prolific content creator, maintaining a YouTube channel focused on factoring tutorials, market analysis, and audiobook summaries related to leadership and business psychology. [1, 2, 3, 4, 5]
Career & Background
Education: He studied Economics at Lafayette College and attended River Dell Regional High School.
Online Presence: He actively shares insights on LinkedIn and Twitter/X, often discussing economic barometers like lumber price fluctuations and their impact on residential construction.
Public Speaking: He frequently appears on podcasts and webinars, such as the Credit on the Go Podcast, to explain the strategic benefits of factoring. [1, 2, 3, 4, 5]
Chris Lehnes manages non-recourse factoring at Versant Funding, where the primary requirement for funding is the credit quality of the account debtor (the customer paying the invoice), rather than the financial strength of the business itself. [1, 2, 3]
Funding Criteria & Terms
Sales Volume: Targets companies with B2B or B2G sales ranging from $100,000 to $30 million per month.
Non-Recourse Protection: Versant assumes the credit risk; if the customer fails to pay due to insolvency, the business is not required to reimburse Versant.
Flexible Concentration: Unlike many lenders, Lehnes often facilitates deals with 100% customer concentration, where a business has only one major client (e.g., a large municipality or multinational corporation).
Funding Speed: Deals can often be funded within one week because traditional underwriting of the borrower’s balance sheet is not required.
Typical Fees: Costs are generally around 2.5% of the invoice amount for each month it remains outstanding.
Excluded Industries: Generally does not factor for the medical (provider-side) or construction industries. [1, 2, 3, 4, 5, 6, 7]
Latest Market Analysis (2025–2026)
Lehnes frequently updates his YouTube and Substack with analyses of the broader economy. Recent highlights include:
Monetary Policy: He recently analyzed the Federal Reserve’s decision to maintain interest rates, discussing the “higher for longer” outlook and its pressure on small business borrowing costs.
Chris Lehnes frequently facilitates complex funding through Versant Funding LLC, often solving liquidity crises for businesses that traditional banks might reject. [1, 2]
Selected Case Studies
$30 Million Furniture Manufacturer (2025): Provided a massive non-recourse facility to replace a non-renewed loan from a previous factor. This deal supported the company through a significant corporate restructuring.
$1.4 Million Auto Equipment Manufacturer (2026): Funded a company supplying global automotive giants. Despite the client’s slow-paying receivables, Versant scaled the facility automatically because the customers were “the strongest on the planet”.
$3 Million Housewares Distributor (2025): Stepped in when the client’s existing factor imposed funding limits that prevented them from fulfilling new orders. Versant consolidated existing loans and provided an advance against all outstanding receivables.
$1.8 Million Adolescent Group Home (2024): Originated a facility for a newly formed social services provider. Because state and county organizations pay slowly, this factoring arrangement provided the necessary liquidity for them to expand into new regions.
Energy Sector Support (2026): Recently focused on the oil and gas industry, helping suppliers bridge working capital gaps caused by the long payment cycles of major energy corporations. [1, 2, 3, 4, 5, 6, 7, 9]
Contact Information
You can reach Chris Lehnes directly for a pre-qualification review or to discuss a specific transaction:
Phone: 203-664-1535
Email: clehnes@VersantFunding.com or chris@chrislehnes.com
Chris Lehnes and Versant Funding prioritize non-recourse factoring because it allows them to fund high-growth or struggling businesses based solely on their customers’ creditworthiness rather than the business’s own financial history. [1, 2]
Recourse vs. Non-Recourse Factoring
The primary difference is who bears the financial risk if a customer fails to pay an invoice. [1, 2]
Recourse Factoring: This is the most common and typically the least expensive option. Under this arrangement, if your customer does not pay their invoice within a set period (usually 60–90 days), your business is responsible for buying back that invoice or replacing it with a fresh one. You retain the ultimate credit risk.
Non-Recourse Factoring: In this model, the factoring company (like Versant) assumes the credit risk. If your customer becomes insolvent or files for bankruptcy, you are not required to pay back the advanced funds. Because the factor takes on more risk, fees are typically higher, and they require strict credit approval of your customers. [1, 2, 3, 4, 5, 6, 7, 8, 9]
Referral Partnership Guidelines
Lehnes actively collaborates with intermediaries, including commercial loan brokers, accountants, and consultants, to source “difficult” deals that traditional banks cannot touch. [1, 2]
Recurring Commissions: Unlike real estate or one-time loan fees, Lehnes offers recurring monthly commissions for the entire life of the deal. If a client factors for three years, the referral partner receives a check every month for those three years.
Strategic Bridge: He encourages partners to use factoring as a short-term bridge (often 24 months) to help companies stabilize until they can qualify for bank financing or complete an equity raise.
Simple Prequalification: To refer a client, you generally only need to provide the client’s industry and a list of their major customers (A/R Aging report). Because Versant does not require full financial audits of the borrower, pre-approval can happen very quickly. [1, 2, 3]
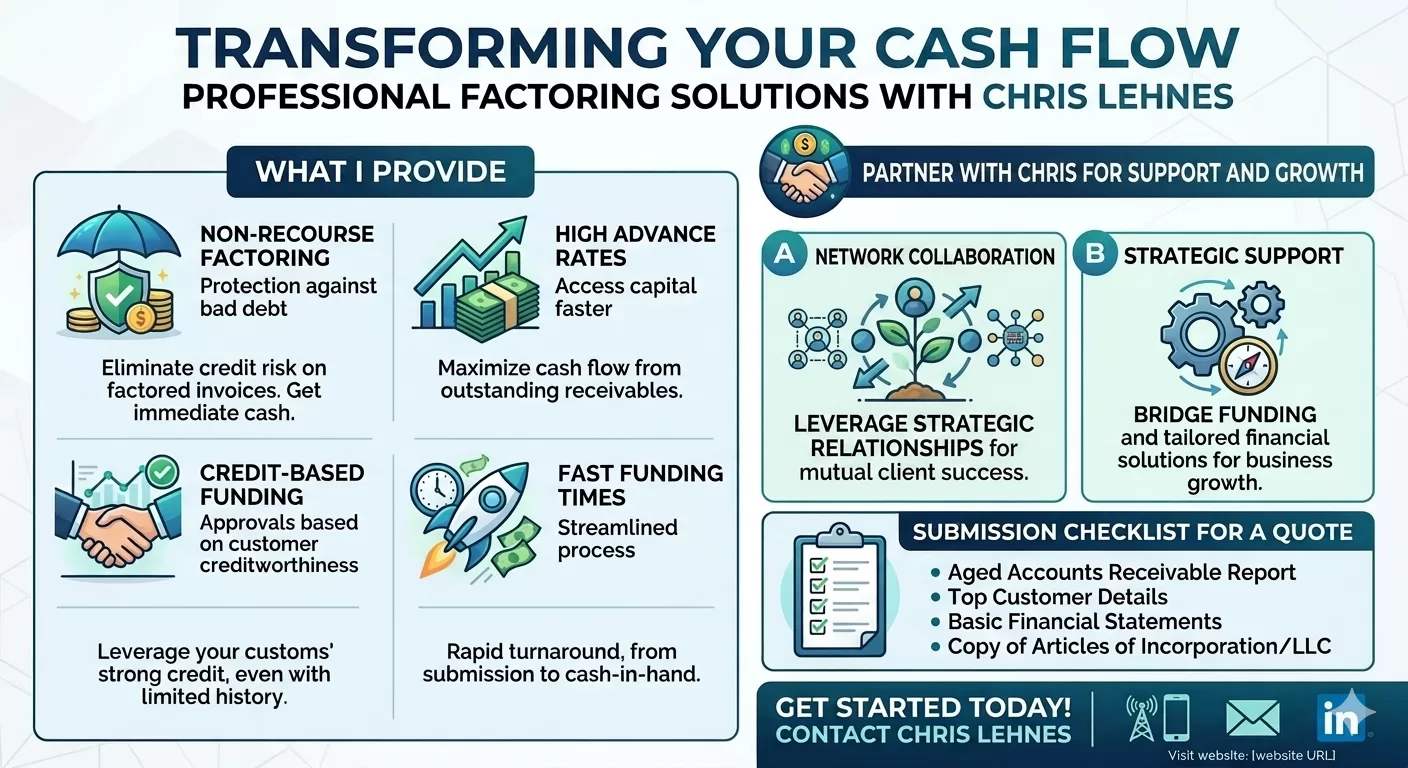
To move forward with a deal for Chris Lehnes at Versant Funding, you typically need a streamlined submission package because they do not underwrite the borrower’s financials—only the collateral (the invoices).
1. Required Documents for a Quote
You can typically get a term sheet or preliminary proposal by submitting just two or three items.
Current A/R Aging Report: This is the most critical document. It must show the names of the customers (account debtors), the amounts they owe, and how long the invoices have been outstanding (0-30, 31-60, 60-90 days).
Customer List with Limit Requests: A list of the specific customers the client wants to factor, including their addresses and the amount of credit limit requested for each. Versant uses this to run credit checks on the debtors.
Sample Invoices: A few examples of the invoices they intend to factor to verify they represent completed work or delivered goods (not progress billing or guaranteed sales).
Simple Application:
Note: You generally do NOT need to submit tax returns, P&L statements, or balance sheets for a preliminary quote, as Versant relies on the credit of the account debtors. [1, 2, 3]
Next Step: If you have a client ready, you can email the A/R Aging Report directly to chris@chrislehnes.com to request a term sheet.
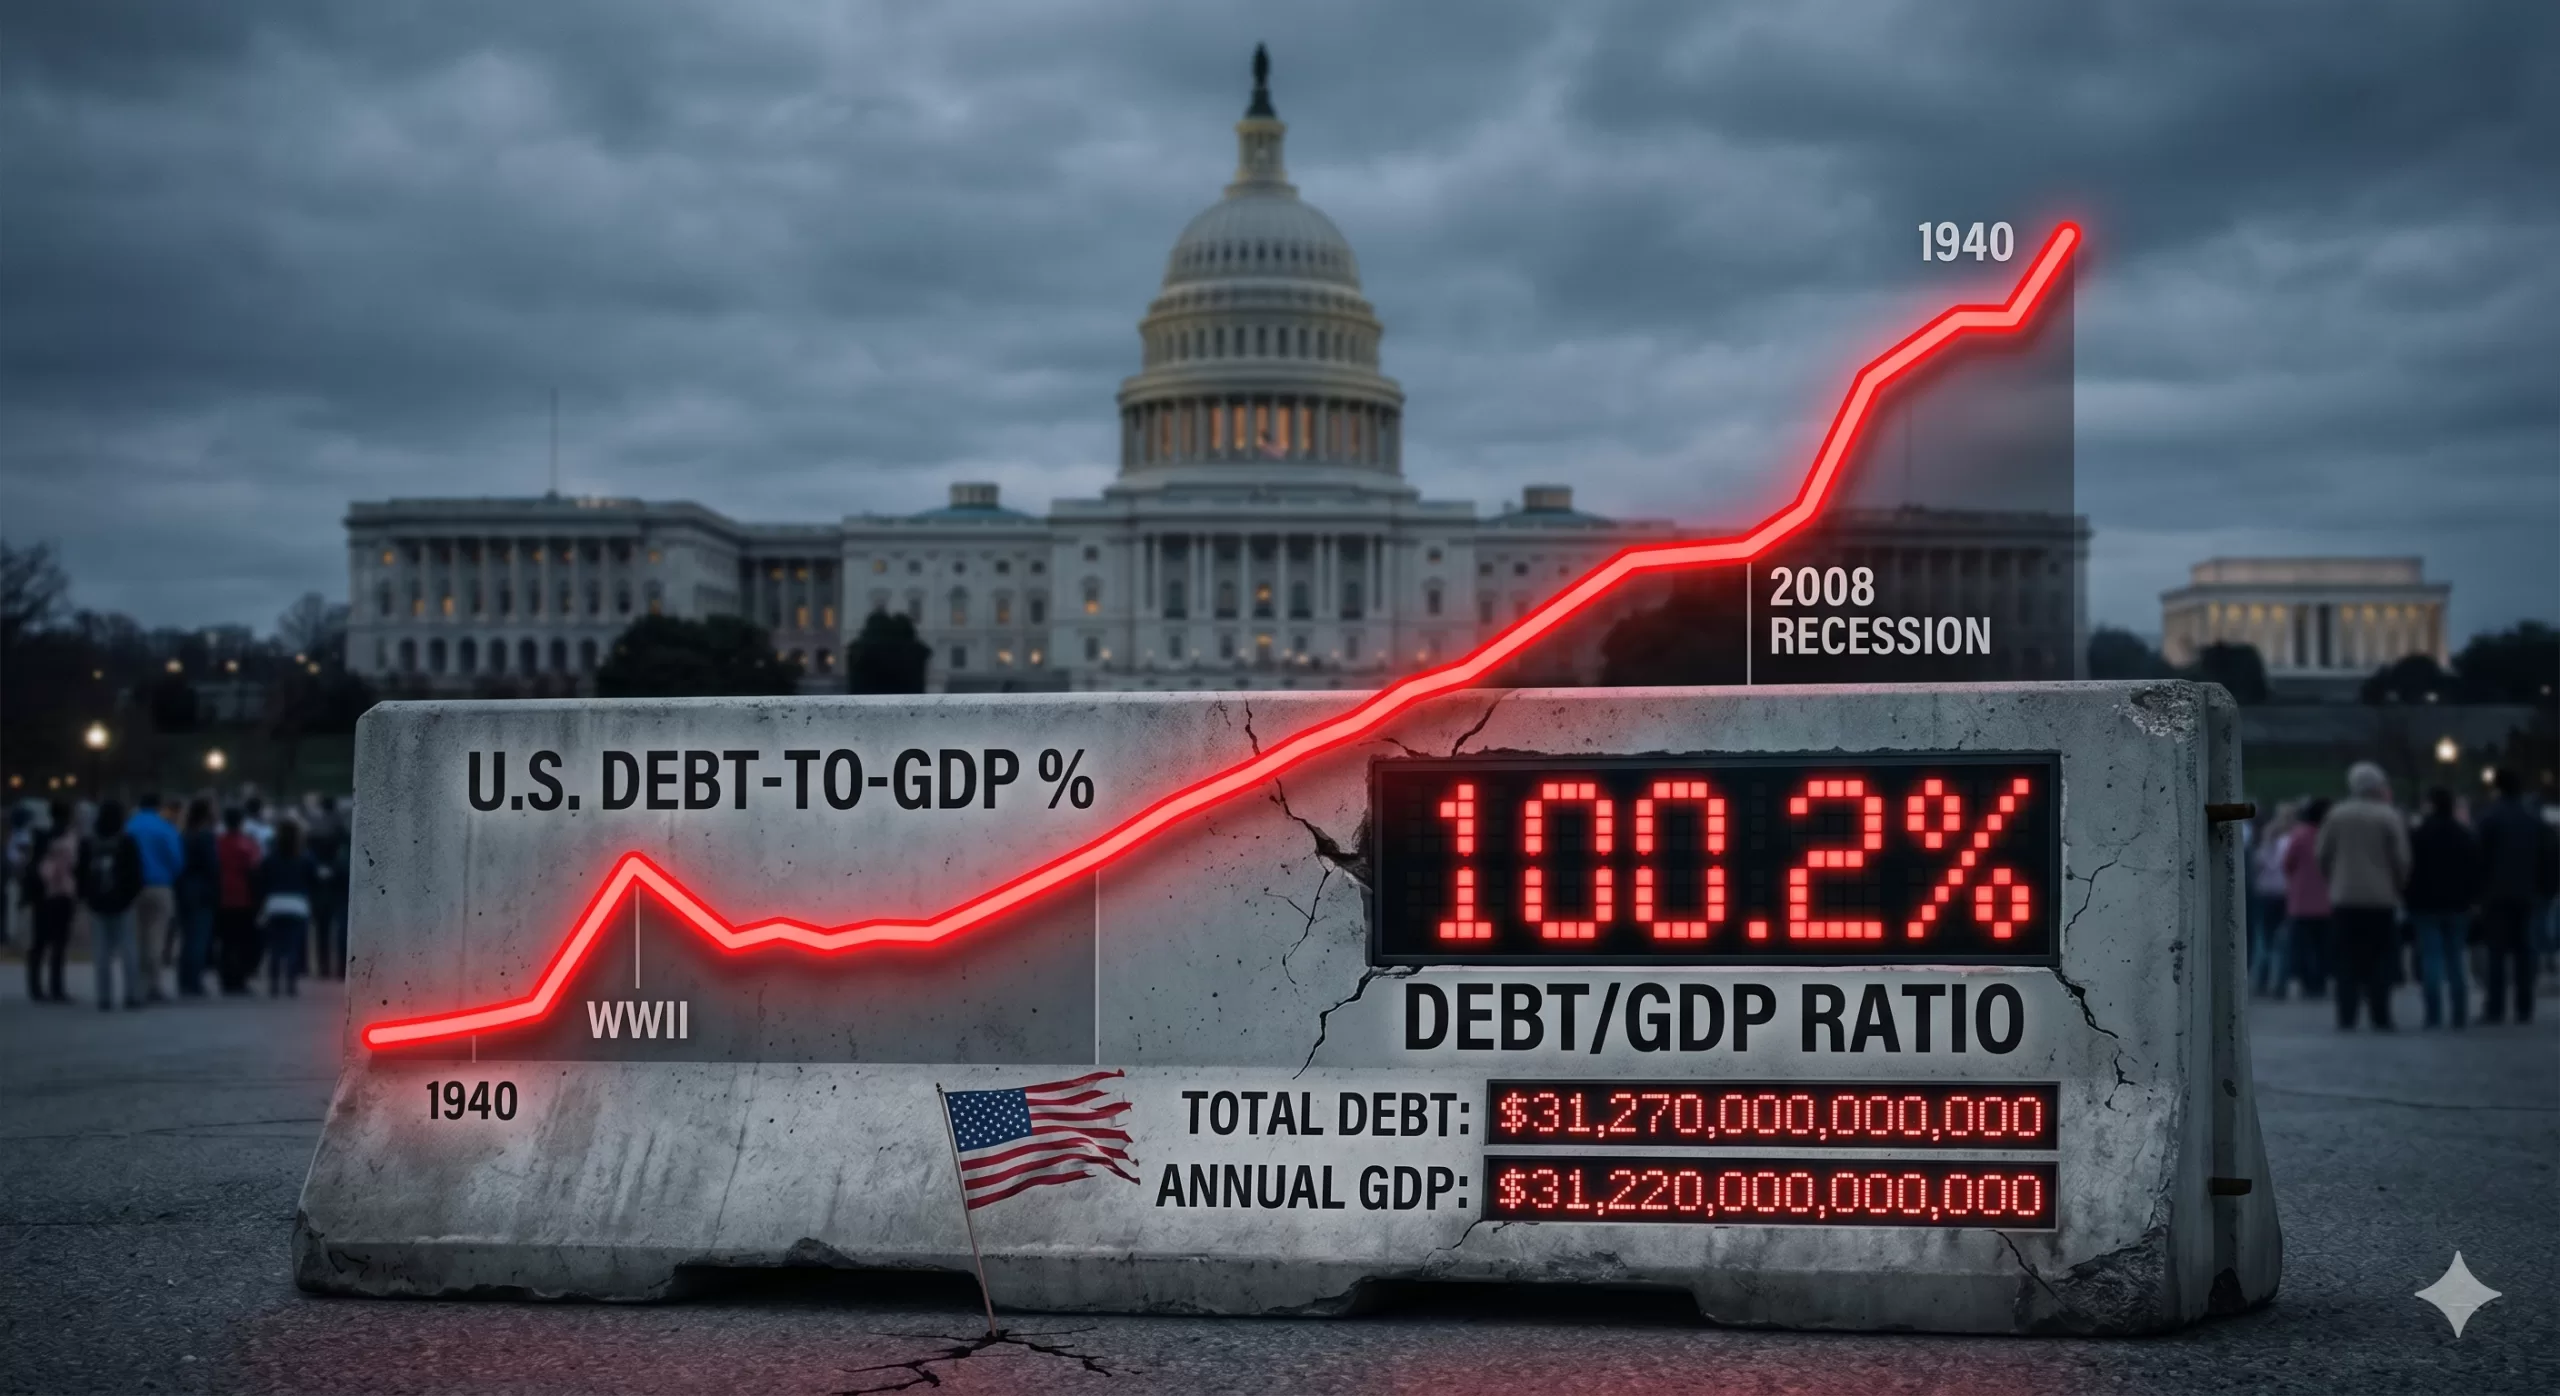
For the first time since the aftermath of World War II, the United States has reached a fiscal milestone that was once a distant “what-if” scenario: the national debt has officially surpassed 100% of the country’s Gross Domestic Product (GDP).
As of March 31, 2026, the debt held by the public reached $31.27 trillion, while the total annual economic output sat at $31.22 trillion. In simple terms, we now owe more as a nation than we produce in an entire year.
While “trillions” can feel like abstract Monopoly money, this 100.2% ratio represents a fundamental shift in the American economic landscape. Here is what you need to know about why this happened and what it means for the future.
How Did We Get Here?
This wasn’t an overnight accident. It is the result of decades of “fiscal kicking the can.” The surge to 100% was fueled by three primary engines:
Structural Deficits: For years, the government has spent roughly $1.33 for every $1.00 it collects in revenue.
The Interest Trap: As the total debt grows, so do the interest payments. In 2026, the U.S. is projected to spend approximately $1 trillion on interest alone—surpassing the entire national defense budget.
Demographic Shifts: An aging population is naturally drawing more heavily on Social Security and Medicare, programs that make up a massive portion of mandatory spending.
Why the 100% Threshold Matters
Economists often debate whether there is a “magic number” where debt becomes fatal. While 100% isn’t an immediate “cliff,” it serves as a critical psychological and economic warning light for several reasons:
Slower Economic Growth: Historical data suggests that when a nation’s debt exceeds 90% of GDP, average annual growth tends to slow. Resources that could be used for private investment or infrastructure are instead diverted to servicing old debt.
Reduced “Crisis Cushion”: When the next pandemic, recession, or war hits, the government has less “dry powder” to respond. Borrowing your way out of a crisis is much harder when your credit card is already maxed out relative to your income.
Generational Equity: The debt essentially represents a “tax” on future generations. Today’s spending is being financed by the earnings of Americans who haven’t even entered the workforce yet.
The Cost to the Average Household
To bring these massive numbers down to earth, the Senate Joint Economic Committee’s April 2026 update provides a sobering breakdown:
Debt per Person: Approximately $114,000
Debt per Household: Approximately $289,000
Is There a Way Out?
The U.S. has been here before. After 1945, the debt-to-GDP ratio was successfully whittled down to 34% by 1980. However, that was achieved through a unique combination of post-war industrial dominance, a massive “Baby Boom” workforce, and rapid GDP growth.
Today, the path is narrower. Solutions generally fall into three difficult categories:
Entitlement Reform: Adjusting Social Security and Medicare to match modern life expectancies.
Revenue Increases: Raising taxes or closing loopholes to narrow the deficit.
Growth Incentives: Policies designed to make the “GDP” side of the ratio grow faster than the “Debt” side.
The Bottom Line
Crossing the 100% threshold is a “reckoning” moment. It signals that the era of “cheap” borrowing is over. As interest payments continue to eat a larger slice of the federal pie, the pressure on the American taxpayer—and the pressure to make hard political choices—will only intensify.
The red line has been crossed. The question now is whether we have the political will to head back toward the black.
If you’ve flown recently, you might have noticed the bright yellow planes of Spirit Airlines are becoming a rarer sight. As of May 2026, the “ultra-low-cost carrier” (ULCC) that changed the way we think about budget travel is locked in a high-stakes battle for its very survival.
After two bankruptcy filings in less than two years and a global energy crisis that sent fuel prices soaring, Spirit is no longer just “restructuring”—it is teetering on the edge of a total shutdown.
A Timeline of Turbulence
To understand how we got here, you have to look at the “Chapter 22” phenomenon (a slang term for when a company files for Chapter 11 twice).
November 2024: Spirit filed its first Chapter 11 bankruptcy after a federal judge blocked its $3.8 billion merger with JetBlue. It emerged quickly in March 2025, but the underlying operational issues remained.
August 2025: Just months later, the airline filed for a second Chapter 11. The goal was a massive overhaul: slashing debt from $7.4 billion down to $2 billion and shrinking the fleet to a lean 76-80 aircraft.
Early 2026: A plan was in place to emerge by summer. Then, geopolitical conflict in the Middle East caused jet fuel prices to double, blowing a hole in the airline’s recovery budget.
The $500 Million Question: Bailout or Bust?
Right now, Spirit is surviving on “days, not weeks” of cash. The current drama is centered in a New York bankruptcy court, where a controversial rescue plan is on the table:
The “Trump Takeover” Proposal: The federal government has discussed a $500 million bailout that would give the U.S. government a90% ownership stakein the airline.
While the administration argues this could save 17,000 jobs and keep fares low, the deal is currently stalled. Major bondholders are balking at being “pushed down” the repayment line by the government, and some officials argue against “putting good money after bad.”
What This Means for Travelers
If you have a flight booked with Spirit, or thousands of Free Spirit® miles saved up, here is the current reality:
Flights are still operating (for now): As of today, Spirit is maintaining its schedule, but the frequency of flights has been cut by over 50% compared to last year.
The “Use it or Lose it” Rule: If Spirit moves from Chapter 11 (reorganization) to Chapter 7 (liquidation), your loyalty points could become worthless overnight. Many experts suggest booking flights with miles now rather than holding onto them.
Fare Hikes: Spirit’s presence has historically kept legacy airlines’ prices in check. It’s estimated that if Spirit exits a route, fares on that route jump by about 23%.
The New “Premium” Spirit
If Spirit does survive, it won’t look like the airline we remember. The restructuring plan involves moving away from the “bare fare” model toward a more upscale experience to compete with Delta and United. This includes adding a third row of Big Front Seats and expanding Premium Economy options across the fleet.
The Bottom Line
Spirit Airlines is currently in the ultimate “emergency landing” scenario. Whether it emerges as a federally-backed “Value” carrier or disappears into the history books alongside names like Pan Am and Air Florida depends entirely on the court hearings happening this week.
If you’re flying Spirit this month, keep a close eye on the news—and maybe have a backup plan ready.
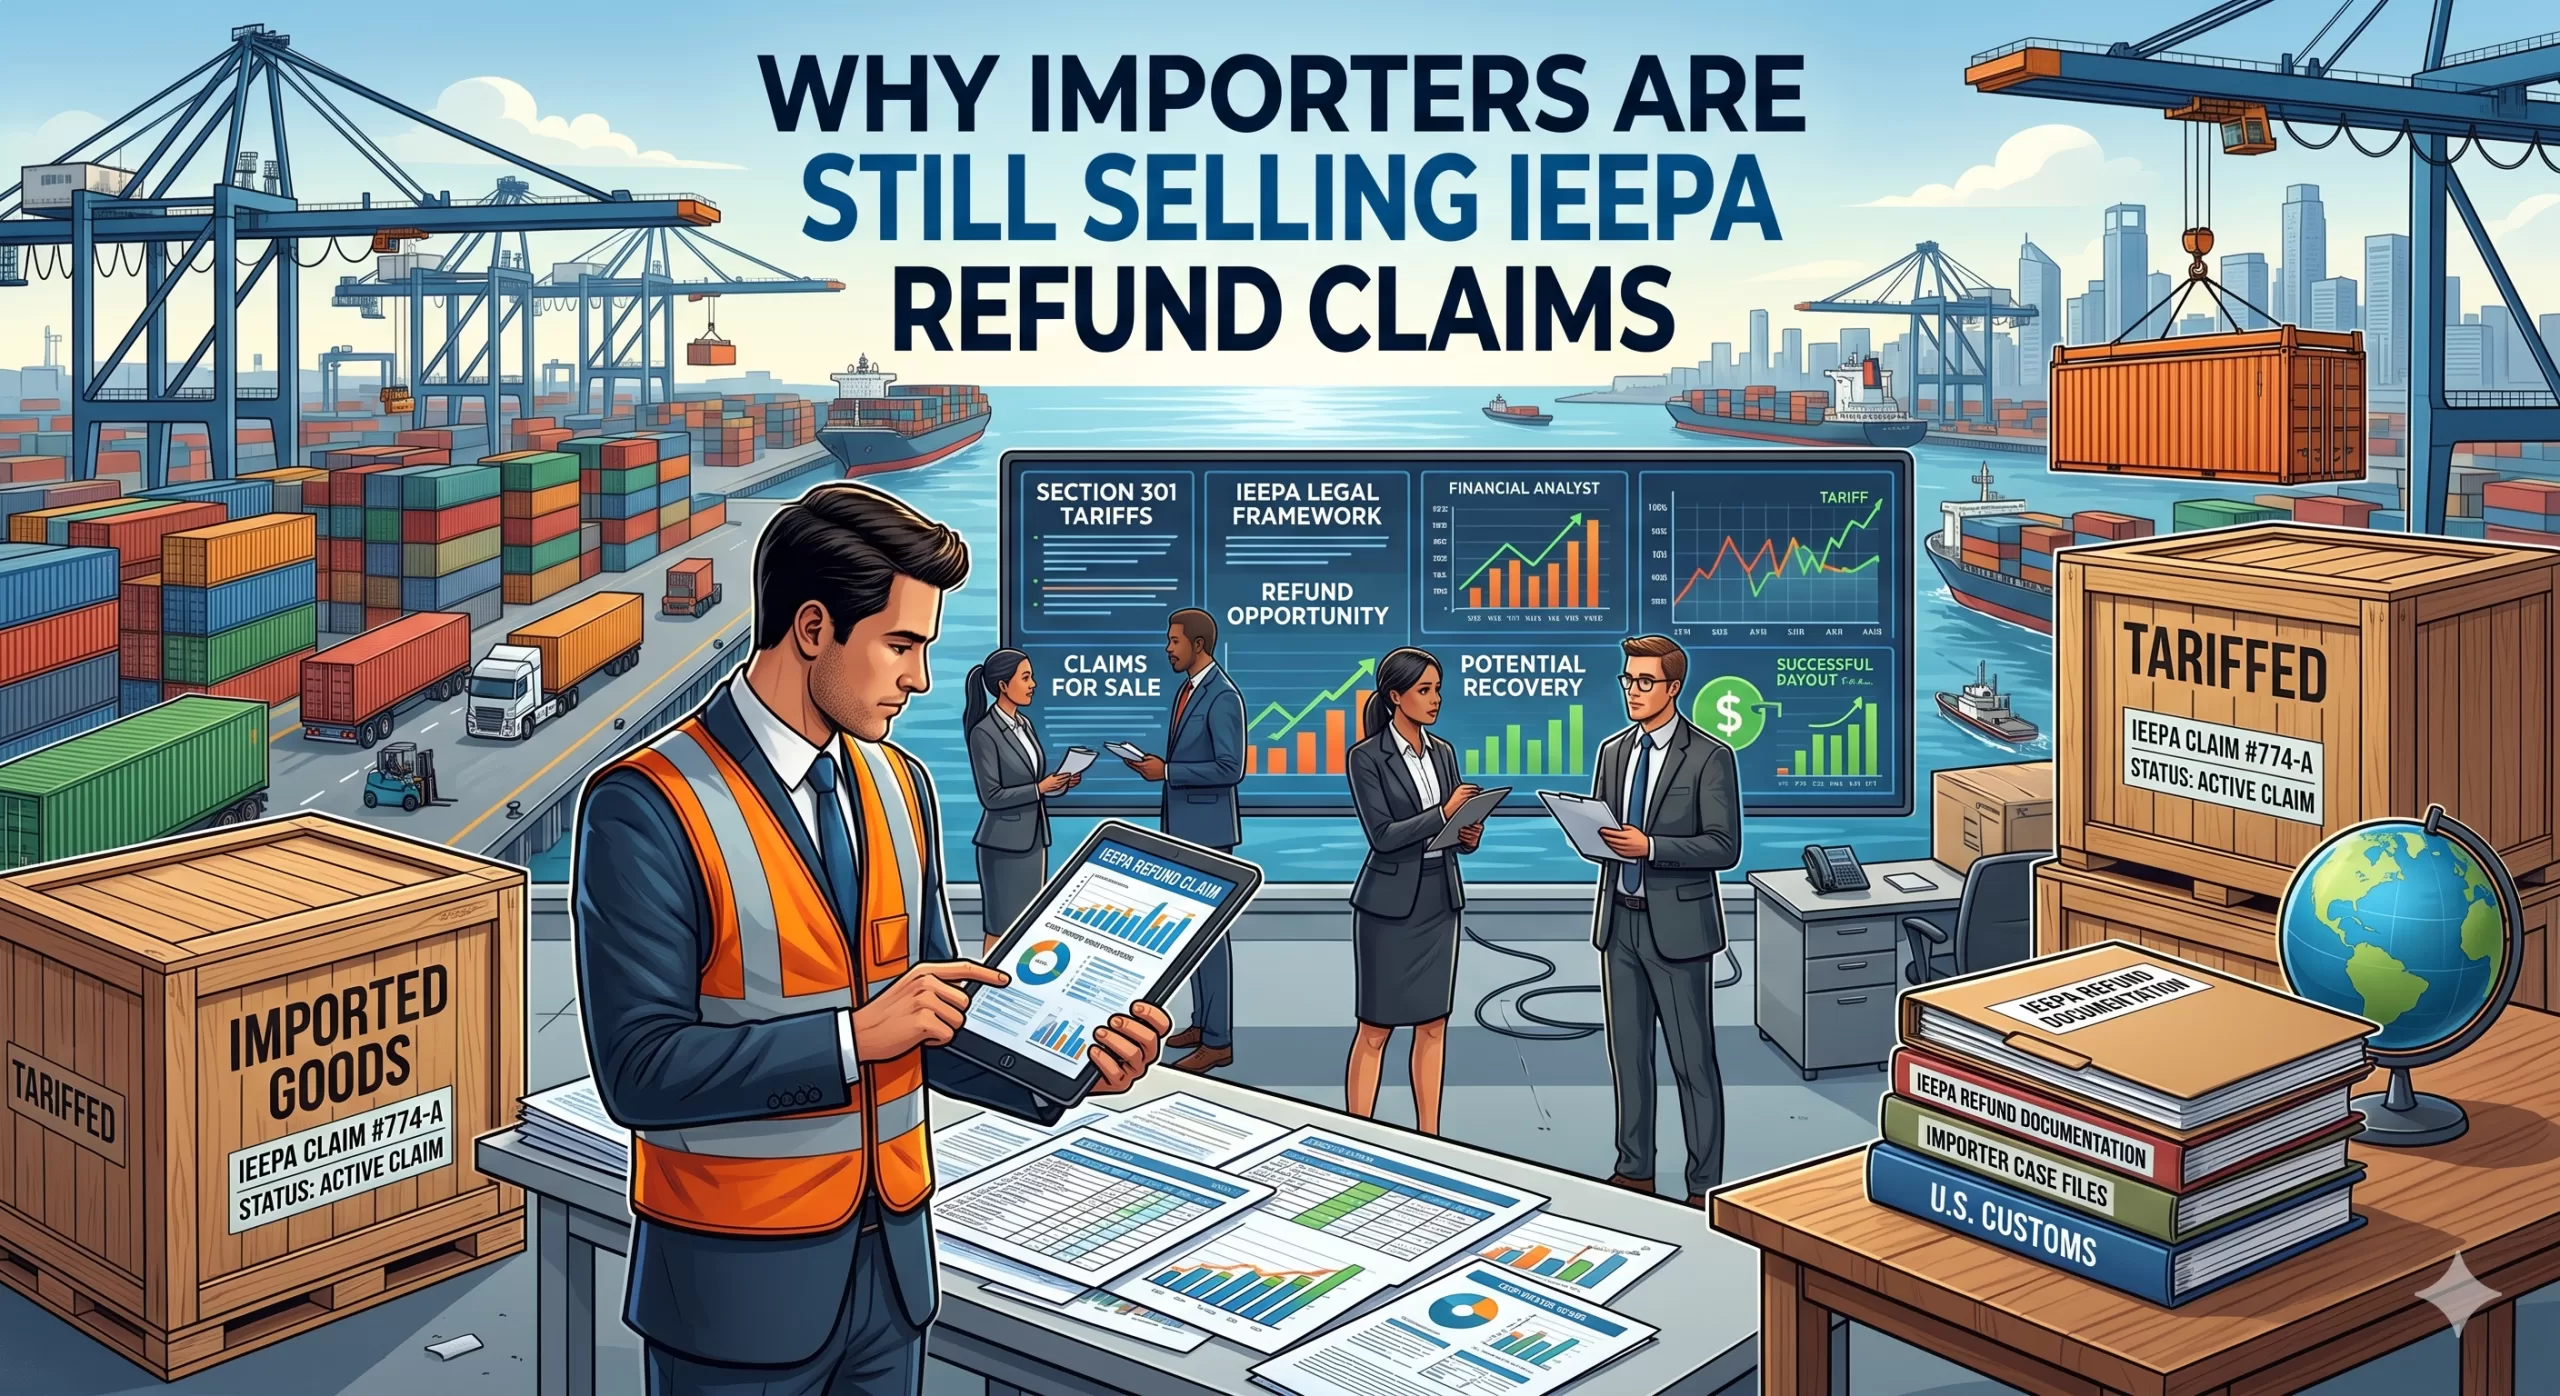
We continue to assist companies nationwide in converting IEEPA tariff refund claims into immediate cash, even after the launch of U.S. Customs and Border Protection’s(“CBP”) CAPE refund portal and the latest April 28th update from the U.S. Court of International Trade (“CIT”).
CIT’s April 28th status review confirmed that the lead IEEPA refund litigation has largely moved from the legal entitlement phase into the implementation and payment phase. In simple terms, the question is no longer primarily whether many importers are entitled to refunds, the issue is when those refunds will actually be paid.
While CBP officially launched CAPE on April 20th to process refunds, there was no new court order requiring immediate payment of all claims. Instead, the CIT is supervising execution, while Customs works through claim submissions, liquidation status, eligibility reviews, and administrative processing. This distinction matters. CBP has indicated that certain accepted claims may be paid within approximately 45–60 days plus statutory interest.
However, “acceptance” is not the same as submission. Importers must first complete filing requirements, resolve broker authority issues, verify liquidation status, satisfy procedural review, and clear compliance review before the payment clock truly begins. For many importers, especially those with older entries, previously liquidated claims, multiple brokers, documentation issues, or claims that may fall outside CAPE Phase 1, the actual recovery timeline could extend for many months or significantly longer. As a result, our buyers remain highly active in purchasing IEEPA tariff refund claims, with transactions from $250,000 to $7 million purchased at a Buy Rate of 85%, while claims exceeding $7 million have a Buy Rate of 90%.
Why Importers are still Selling Tariff Refund Claims after CAPE Opened
Judge Eaton of CIT did not order immediate universal payment of all claims. CBP’s estimated payment window begins only after formal claim acceptance, not submission.
Many claims do not clearly qualify for CAPE Phase 1 and may require later phases. Finally liquidated entries remain one of the largest unresolved issues. Previously liquidated entries may still require protests, reliquidation, or additional litigation. The right to a refund is clearer—but the timing of payment remains uncertain.
CSV upload issues, ACE access problems, and broker mismatches can delay acceptance. Documentation gaps and reconciliation issues remain common. Customs audit and compliance review may delay payment even after filing.
Trump Administration appeal deadlines and future legal developments could delay the timing of refund payments. Processing millions of entries may create substantial administrative backlogs. Port-by-port inconsistencies may slow recovery for certain importers. Working capital needs often cannot wait for government processing timelines/.
Importers Are Choosing To Monetize Now
Immediate working capital for inventory, payroll, and vendor obligations. Reduced lender pressure and improved borrowing base flexibility. Elimination of refund timing risk and litigation uncertainty. Improved balance sheet certainty. Faster access to liquidity without waiting for government disbursement. Stronger buyer pricing now that CAPE implementation is underway as Buy Rates increased from 45% in February to 85% today
For many businesses, immediate liquidity today is worth more than waiting for a larger payment later. Many importers are no longer asking. “Will I get paid?”, They are asking, “Is waiting worth the delay, uncertainty, and operational risk?”. For many companies, the answer is no. We work with importers with claims starting at $250,000, with no maximum limit across industries including food, seasonal goods, apparel, and home products.
Most transactions can be completed in approximately 10 business days, assuming proper documentation and credit quality.